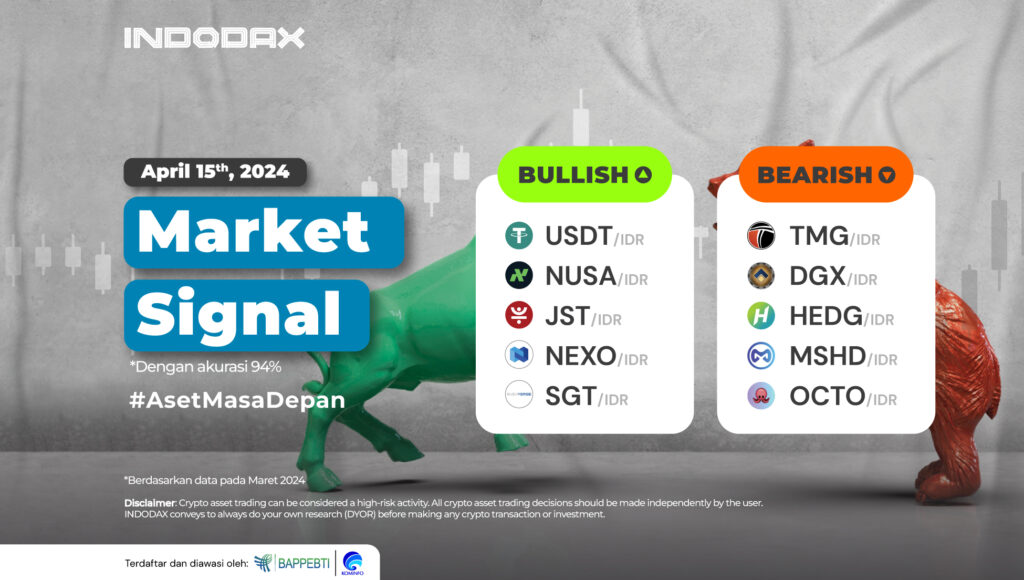
This week, USDT (USDT) and Nusa (NUSA) are leading in the bullish position with positive performance movements.
Curious about what crypto assets are experiencing bullish or bearish trends this week? Check out the full INDODAX Market Signal update below!
5 Bullish Crypto Assets
1. USDT (USDT)

The movement of USDT (USDT) on the 1-Day chart shows a positive performance, where while in the uptrend phase, USDT (USDT) has strengthened more than 5% and is one of the stable coins available at INDODAX. When looking at the RSI indicator, USDT (USDT) is currently overbought, and the opportunity for USDT (USDT) to weaken is quite large, with the closest support level at 16,200.
2. Nusa (NUSA)

The 1-Day Chart can identify that Nusa (NUSA) has been in an uptrend phase since February 28, 2024. This is inseparable from the positive end of the sideways phase in the 105,000-120,000 range. The MACD indicator shows indications of trend weakening, but this will be confirmed by candles moving below the 150,000-165,000 area.
3. JUST (JST)

JUST (JST) bullish trend will come under pressure if candles form below the 485-520 area, suppressing positive momentum. The biggest impact of the trend switch to bearish, as marked by the EMA/200, was unsuccessful in holding the price weakness, and then the dominant support of 420-450 was broken.
4. Nexo (NEXO)

The wide price area of 15,000-20,000 is one of the decisive areas for the Nexo (NEXO) trend. Whether it survives or is broken down, it will increase negative momentum for Nexo (NEXO).
5. Suzuverse (SGT)
 Suzuverse (SGT) is still bullish. Although the EMA/200 was broken several times, no candle was formed below the EMA/200. Suzuverse (SGT) strengthening will try to form a candle above the 70,000-75,000 area. If it can be realized, it is estimated that the bullishness will be even stronger.
5 Bearish Crypto Assets
1. T-mac DAO (TMG)
 Indicated to be in the bearish zone after the candle experienced a deep weakening and formed below the 260,000 price level is one of the causes for T-mac DAO (TMG). The RSI indicator assumes that T-mac DAO (TMG) is currently in an oversold area with support levels available at 125,000-150,000.
2. Digix Gold Token (DGX)
 Digix Gold Token’s (DGX) bearish trend will fail to continue if the 820,000-850,000 area can be crossed, followed by a candle with a complete shape forming. The MACD indicator will portray positivity if this can be realized.
3. HedgeTrade (HEDG)

HedgeTrade (HEDG) has not been able to stay above the WMA/85, causing negative pressure on the price of HedgeTrade (HEDG). The trend will be indicated to deepen to continue weakening if the 145-155 support area is broken.
4. MASHIDA (MSHD)

The WMA / 75 line is still holding the current trend of MASHIDA (MSHD); if the line does not succeed in holding the weakening of MASHIDA (MSHD), then the opportunity for MASHIDA (MSHD) to decline further is getting bigger and will test support at 55.
5. OCTO (OctoFi)

Had broken the EMA/200 but not followed by a candle that formed above the EMA/200, the price of OCTO (OctoFi) weakened again, and the bearish trend continued. Support at 5,110 was broken, making OCTO (OctoFi) negatively pressured and requiring a fairly high price improvement to break the 7,000-8,500 area.
NOTES:
If EMA 5 crosses the WMA 75, 85, and EMA 200 lines, and these lines intersect from bottom to top, then the market trend tends to be upward (bullish).
Each table above shows that when the value of EMA 5 is higher than WMA 75,85 and EMA 200, the market tends to rise (bullish).
If the RSI and MACD values show the same condition, the market is showing the same trend; an overbought (overbought) or oversold (oversold) condition indicates that the market is at the point of changing trend direction.
 Market

