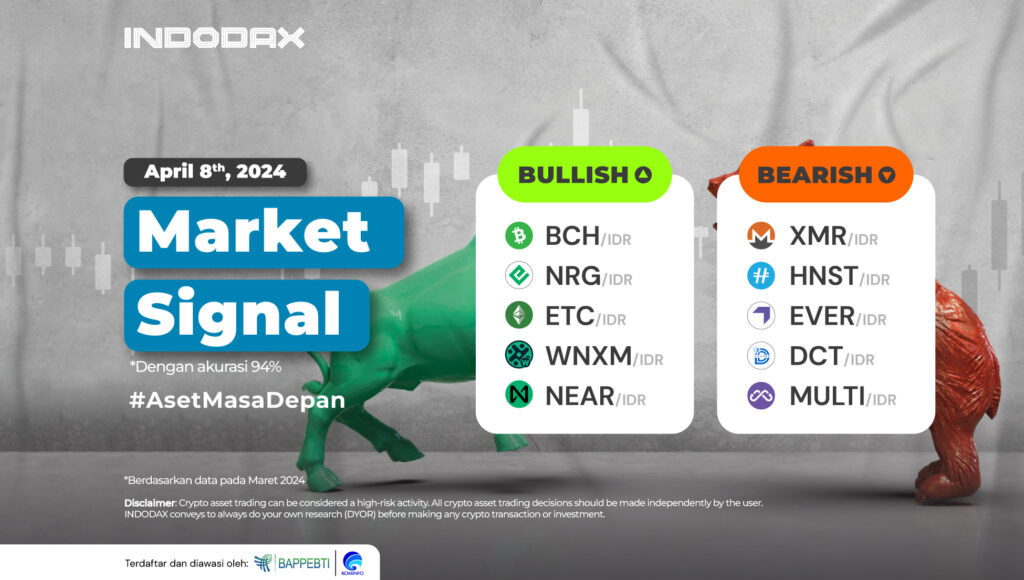
In the ranks of bullish crypto assets, Bitcoin Cash (BCH) leads at the top, followed by Ethereum Classic (ETC) to NEAR Protocol (NEAR).
Curious about what crypto assets are experiencing bullish or bearish trends this week? Check out the full INDODAX Market Signal update below!
5 Bullish Crypto Assets
1. Bitcoin Cash (BCH)

On the 1-Day timeframe, it can be identified that Bitcoin Cash (BCH) in the bullish phase has increased quite high, with the price having strengthened by more than 250% since July 11, 2023, and touched its highest price since November 2021. The bullish phase is expected to dominate the next movement further if the candle can form above the price of 12,000,000.
2. Energi (NRG)
 The resistance area on Energi (NRG) is at 3,800-4,600, assuming that if the area is successfully broken, the bullish trend will be stronger to continue. The next level is available in the range of 5,800-7,000.
3. Ethereum Classic (ETC)

The price strengthening on Ethereum Classic (ETC) is inseparable from the trend that managed to stay above the WMA/75 and move in line with the uptrend. When looking at the MACD indicator, Ethereum Classic (ETC) is not volatile and has not managed to confirm its movement with the indicated resistance area at the 565,000-621,000 level.
4. Wrapped NXM (WNXM)
 The switch from a bearish trend to a bullish one has positively impacted the price of Wrapped NXM (WNXM). Since March 12, 2023, Wrapped NXM (WNXM) has gained more than 200%. The ongoing weakness will try to move below the WMA/85 with the support area at 700,000-900,000.
5. NEAR Protocol (NEAR)

NEAR Protocol (NEAR) has a support level of 85,000-100,000. If this level is breached, testing the next support at 60,000-73,000 will be possible. A possible assumption is that the WMA/85 line cannot withstand the weakness and pushes the candles to move below the line.
5 Bearish Crypto Assets
1. Monero (XMR)
 Unable to break and hold above 2,800,000, Monero (XMR) weakened until the bullish trend became bearish in the 1-Day timeframe. The bearish phase of Monero (XMR) will be more dominant to continue if the candles cannot hold above the 1,500,000-1,650,000 area.
2. Honest (HNST)

In the 1-Day chart movement, it can be seen that Honest (HNST) experienced several significant price decreases and increases but did not form a complete candle, so resistance and support were only broken for a short time.
3. Everscale (EVER)

Everscale (EVER) is still bearish, where the candle has been unable to break the EMA/200, so Everscale (EVER) is in negative momentum. If it can break from the 900 -1,000 resistance area, Everscale (EVER) will correct the bearish trend.
4. Degree Crypto Token (DCT)

Still moving stagnant in the bearish sideways phase with a price range of 20,000-30,000 impacts the price of Degree Crypto Token (DCT) which cannot make price changes quite volatile. This is in line with the indicator used, namely MACD, which allows a longer time to be required for Degree Crypto Token (DCT).
5. Multichain (MULTI)
 Multichain (MULTI) has been indicated to be in a downtrend zone since February 9, 2024, where the price of Multichain (MULTI) has weakened by more than 50%. Multichain (MULTI) is expected to weaken if the trend still moves below the WMA/85, which will harm price changes and push Multichain (MULTI) to touch its lowest price.
NOTES:
If EMA 5 crosses the WMA 75, 85, and EMA 200 lines, and these lines intersect from bottom to top, then the market trend tends to be upward (bullish).
Each table above shows that when the value of EMA 5 is higher than WMA 75,85 and EMA 200, the market tends to rise (bullish).
If the RSI and MACD values show the same condition, the market is showing the same trend; an overbought (overbought) or oversold (oversold) condition indicates that the market is at the point of changing trend direction.
 Market

