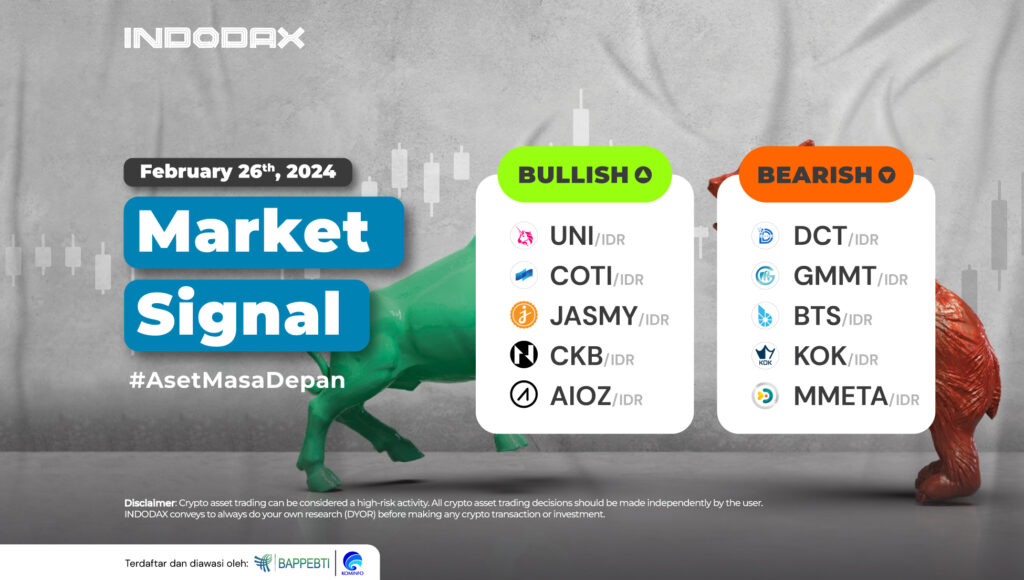
In the last week of February, the ranks of crypto assets on a bullish trend were occupied by Uniswap (UNI) to Nervos Network (CKB) with dominating price increases.
Curious about what crypto assets are experiencing bullish or bearish trends this week? Check out the full INDODAX Market Signal update below!
5 Bullish Crypto Assets
1. Uniswap (UNI)

Staying above the EMA/200 line is one of the positive turning points for Uniswap (UNI) trend change. The 90,000 resistance passed is a decisive factor for Uniswap (UNI) to turn bullish. The chance for Uniswap (UNI) to move volatile is quite high. The two lines of the Bollinger Bands indicator are moving away from each other and will have a positive impact until Uniswap (UNI) hits the highest price since 2022.
2. Coti (COTI)
 Coti (COTI) has strengthened by more than 100% since being in a bullish trend. This massive strengthening indicates that Coti (COTI) is currently in an overbought area, and it is estimated that if a candle does not form above the price of 4,000, then the indication to strengthen the trend is under pressure.
3. JasmyCoin (JASMY)

JasmyCoin (JASMY) price has not been able to cross the 290-320 area. If this area can be passed, it will be a positive momentum that can strengthen the price and continue the bullish trend of JasmyCoin (JASMY) on the 4-hour chart.
4. Nervos Network (CKB)

The price increase on Nervos Network (CKB) is dominating, where the change and shift in trend are in line with the positive candle movement against the WMA/85, increasing by more than 100%. The resistance area is available in a fairly wide price range, namely 275-350. This area will be one of the determinants of Nervos Network (CKB) to go to a higher price.
5. AIOZ Network (AIOZ)

Weakened to test the WMA/85 as it did not manage to break the price of 3,000, the price of AIOZ Network (AIOZ) then rebounded, and the price was passed, so the price of AIOZ Network (AIOZ) responded positively with a gain of more than 40%.
5 Bearish Crypto Assets
1. Degree Crypto Token (DCT)
 The price weakness on Degree Crypto Token (DCT) is unstoppable. Degree Crypto Token (DCT) has experienced more than 50% price weakness since being in the bearish phase. Currently, the trend is indicated to be in the oversold zone, but if the candles still do not move from the WMA/75, then negative pressure will still dominate the price changes.
2. Giant Mammoth (GMMT)

The failure of Giant Mammoth (GMMT) to cross the EMA/200 made Giant Mammoth (GMMT) weak, and the trend turned into a downtrend. The trend depicted by MACD is narrowing and requires further time to confirm the next trend movement.
3. BitShares (BTS)

On the chart used, namely 1 Day, it can be illustrated that BitShares (BTS) is experiencing bearish sideways with a price movement range of 55-70. MACD illustrates a similar thing: if support cannot withstand price weakness, then BitShares (BTS) will touch its weakest price since it got listed on INDODAX.
4. Kok (KOK)

There are no promising positive changes in the price movement and trend of Kok (KOK). This is inseparable from the price that has been unable to move from the WMA/85, so the 350-400 resistance trend cannot be broken.
5. Duckie Land (MMETA)
 Although the price of Duckie Land (MMETA) had broken the EMA/200 line several times, the bearish trend continued. This is because the formation of a candle did not follow the break of the line, and negative pressure still dominates the price changes of Duckie Land (MMETA).
NOTES:
If EMA 5 crosses the WMA 75, 85, and EMA 200 lines, and these lines intersect from bottom to top, then the market trend tends to be upward (bullish).
Each table above shows that when the value of EMA 5 is higher than WMA 75,85 and EMA 200, the market tends to rise (bullish).
If the RSI and MACD values show the same condition, the market is showing the same trend; an overbought (overbought) or oversold (oversold) condition indicates that the market is at the point of changing trend direction.
 Market

