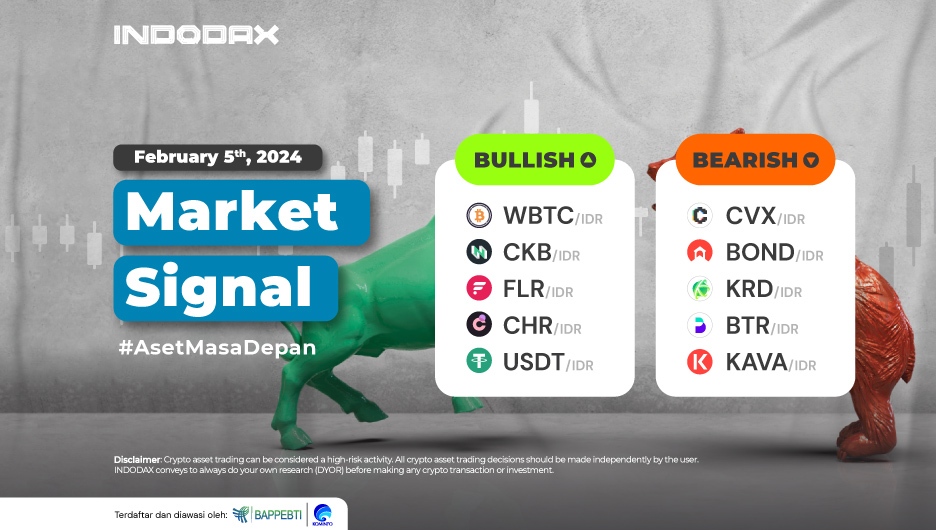
The positive trend of crypto assets this week was led by Wrapped Bitcoin (WBTC), Nervos Network (CKB), to Flare (FLR) in the bullish range.
Curious about what crypto assets are experiencing bullish or bearish trends this week? Check out the full INDODAX Market Signal update below!
5 Bullish Crypto Assets
1. Wrapped Bitcoin (WBTC)

The strengthening of Wrapped Bitcoin (WBTC) in the 1-Day timeframe is inseparable from the trend that can hold above the dominant support area of 335,000,000-375,000,000, which causes the trend to continue strengthening by more than 40%. The strengthening in the price of Wrapped Bitcoin (WBTC) will continue if the candle with a complete shape can break the level in the range of 750,000,000-800,000,000.
2. Nervos Network (CKB)

The strengthening in Nervos Network (CKB) is in line with what is depicted by the MACD indicator, where the breakdown of level 45 confirms the positive intersection of the two indicator lines. The dominant resistance in the 80-106 area will determine the trend change for Nervos Network (CKB).
3. Flare (FLR)

Flare (FLR)’s 4-Hour Trend indicates that a bullish phase has occurred since November 5, 2023, confirmed after a fairly strong resistance at 195-205 was passed and a candle formed. Flare (FLR) has now touched an all-time high (ATH) on price movement.
4. Chromia (CHR)

Chromia’s (CHR) uptrend phase will indicate that it is stronger to continue if a candle with a complete shape can be created above the 4,500-5,000 area, impacting the trend change on the MACD indicator.
5. USDT (USDT)

There is a dominant area for USDT (USDT) at 15,850-15,980, where if this area cannot be broken, then indications for continued strengthening for USDT (USDT) will be restrained, and instead, the potential for weakness will test 15,300-15,500.
5 Bearish Crypto Assets
1. Convex Finance (CVX)

When looking at the price movement of Convex Finance (CVX), it can be estimated that the downtrend phase of Convex Finance (CVX) will fail to continue if the candle can form above the 70,000-78,000 area. With this assumption, a new phase will be created.
2. BarnBridge (BOND)

Touching the price of 150,000, which is the highest price of BarnBridge (BOND) since listing on INDODAX, this became a turning point for BarnBridge (BOND) to weaken deep enough to switch the trend to bearish.
3. Krypton DAO (KRD)

The unsuccessful candle to form above the 20,000-24,000 area became a moment for Krypton DAO (KRD), so the price of Krypton DAO (KRD) weakened again and continued the ongoing bearish trend. On the contrary, the bearish phase will be stronger if the 11,000 level can be broken.
4. Btrips (BTR)

The MACD indicator still illustrates that it will take more time for Btrips (BTR) to confirm the next move, but one important indication for price strengthening will be created if the EMA/200 can be broken.
5. Kava (KAVA)
 January 22, 2024, there is a very deep negative axis for Kava (KAVA) so that it touches the lowest price level of Kava (KAVA) since it was traded on INDODAX. The bearish trend is held by support in the price range of 10,000. If a candle forms below that level, bearish indications will dominate even more.
NOTES:
If EMA 5 crosses the WMA 75, 85, and EMA 200 lines, and these lines intersect from bottom to top, then the market trend tends to be upward (bullish).
Each table above shows that when the value of EMA 5 is higher than WMA 75,85 and EMA 200, the market tends to rise (bullish).
If the RSI and MACD values show the same condition, the market is showing the same trend; an overbought (overbought) or oversold (oversold) condition indicates that the market is at the point of changing trend direction.


