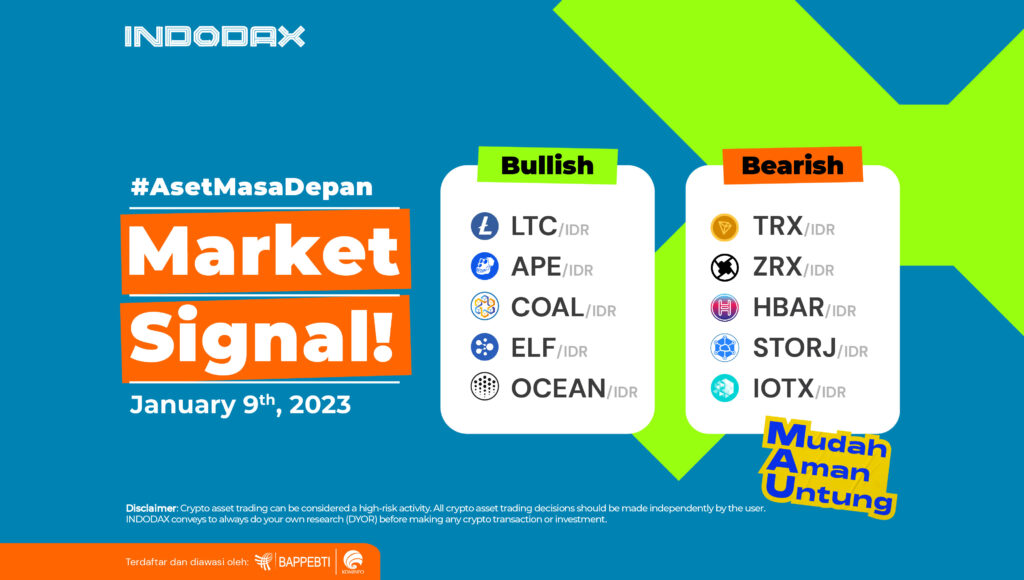
Hello Indodax members! Let’s take a look at Indodax’s market signals and find out which crypto assets are indicated to be bullish and bearish this week.
5 Bullish Crypto Assets
Litecoin (LTC)

Having been in the Bearish zone since December 31, 2021, LTC was able to confirm the end of the Bearish trend and switch to the Bullish trend.
Unable to continue weakening below the Support level area of 920,000 – 990,000, followed by a chart that was able to strengthen through the 1,080,000 level.
ApeCoin (APE)

On the 4-hour chart, APE continues to experience quite a good strengthening by looking at the movement in the trend since the Uptrend on January 04, 2023.
Until now, ApeCoin has climbed around 9%. The trend will strengthen its position in the bullish trend if it can stay above the resistance level area in the range of 68,500 – 70,000.
Coalculus (COAL)

After the resistance level in the range of 45 – 60 is broken, there is an indication that COAL is strengthening, where the trend turning point is when Coalculus can break the EMA/200, which indicates price strengthening with positive momentum is on Coalculus’ side.
The trend will remain in the bullish zone if Coalculus can move and hold above WMA/75.
Aelf (ELF)

If you look at ELF price movements on the 4-hour chart, it can be indicated that price changes are very volatile, with the Bollinger Bands indicator showing a widening in both areas.
The Bullish Aelf trend will be suppressed if the price cannot stay above the EMA/200. Then, this will be followed by a candle that can pass through the 1,600 – 1,865 area.
Ocean Protocol (OCEAN)

Not passing the Support level at 1,920 – 2,200, the price moved relatively static and gave the 2,260 level.
It positively impacted the direction of price movement and ended the Bearish trend.
It will try to stay above the 2,850 level if the weakening occurs. If the trend can stay above that price, it will increase the chances for Ocean Protocol to continue a positive movement. Still, conversely, if it passes that level, it will increase the indication for OCEAN to go to the price of 2,500.
5 Bearish Crypto Assets
Tron (TRX)

The selling pressure was big enough to make TRX unable to stay above the Support level, which was strong enough at the price of 835 – 850 to ensure TRX moves in a Bearish trend.
Having weakened to touch the 783 price level, which is the lowest price since November 15, 2022, the price has strengthened again to try to penetrate the 835 level.
0x (ZRX)

The 4-hour time frame indicates that ZRX has been in the bearish zone since November 10, 2022. The price has weakened, followed by a break in the 3.675 – 3.870 area.
Opportunities for a trend reversal are still wide open, with several indications, such as going above WMA/85, and then the price must stay above the 2,785 – 2,900 area level.
Hedera Hashgraph (HBAR)

It touched the price of 555, but then the MACD indicator showed a line crossing in the positive direction and changed the price direction to a trend improvement but still in the Bearish zone.
HBAR will be able to end the movement in the Downtrend zone if it can pass through the Resistance level, which is quite dominant in the 700 – 735 area.
Storj (STORJ)

The trend movement on the 1-day time frame indicates that if it is in the Downtrend zone, the price has touched the 2,330 level several times but has strengthened again in a more limited manner.
The price will try to stay above 3,400 with an estimate that if there is a strengthening, it will try to penetrate 6,410.
IoTeX (IOTX)
The decline in IOTX deepened after the price was unable to pass the price of 630 – 720. This indicates that since the overall price movement it can be seen that since the first listing on Indodax, IoTeX has continued to decline.
The MACD indicator shows if the current trend is in a positive area, seeing if the price has weakened deep enough, the potential to strengthen is wide open. Strengthening will go to the nearest Resistance level at level 444.
NOTE: If the 5 EMA crosses the WMA 75, 85 and 200 EMA lines and the lines intersect from the bottom up, then the market trend tends to go up (bullish), each table above shows that if the 5 EMA value is higher than the 75.85 WMA and 200 EMA, the market tends to go up (bullish).
If the RSI and MACD values ??show the same condition, it means that the market is showing the same trend. Overbought or oversold conditions are an indicator that the market is already at the point of changing direction of a trend.
ATTENTION: All contents which includes text, analysis, predictions, images in the form of graphics and charts, as well as news published on this website, is only used as trading information, and is not a recommendation or suggestion to take action in transacting either buying or selling. certain crypto assets. All crypto asset trading decisions are independent decisions by the users. Therefore, all risks arising from it, both profit and loss, are not the responsibility of Indodax.


 Polkadot 9.84%
 BNB 0.46%
 Solana 4.45%
 Ethereum 3.12%
 Cardano 1.76%
 Polygon Ecosystem Token 2.67%
 Market


