Start the new year with crypto asset investment opportunities for #AsetMasaDepan.
Curious about which crypto assets are experiencing bullish or bearish trends this week? Check out the complete INDODAX Market Signal update below!
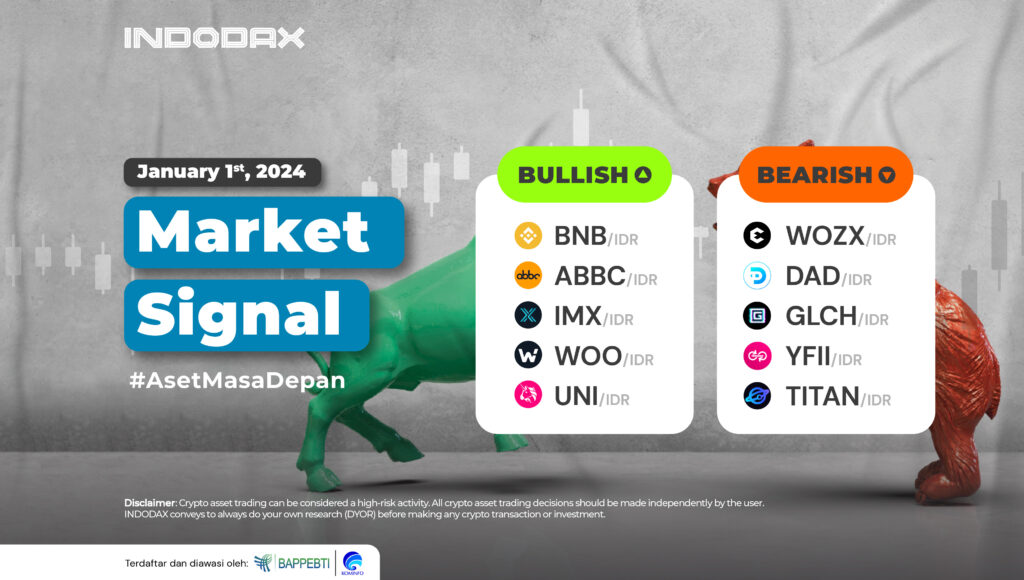
5 Bullish Crypto Assets
1. BNB (BNB)

BNB (BNB) experienced a fairly high price increase. Since being bullish on December 12, 2023, BNB (BNB) has rallied more than 20%. However, the trend is indicated to have moved from the overbought area on the RSI indicator, with support levels available in the 4,600,000-4,800,000 area.
2. ABBC Coin (ABBC)

The trend of ABBC Coin (ABBC) is currently moving in a positive area. This is shown by the MACD indicator with several dominant resistance zones successfully being passed, such as the 770-835 and 980-1,000 areas. If ABBC Coin (ABBC) can maintain momentum, then the rate of price change will become more volatile for ABBC Coin (ABBC).
3. Immutable X (IMX)

The dominance of the sideways zone moving in the 7,300-12,000 area ended positively after the resistance was broken to confirm the change in the Immutable X (IMX) trend to an uptrend. Sustaining above the 23,000-27,000 area will indicate positive momentum still dominates price changes.
4. WOO Network (WOO)

Strengthening in the WOO Network (WOO) started when the trend strengthened following the movement of WMA/75 so that it could push the trend to enter the uptrend phase. The opportunity for WOO Network (WOO) to continue strengthening is quite high, considering that the MACD indicator indicates that the trend is moving positively.
5. Uniswap (UNI)
 Uniswap (UNI) is currently in a bullish trend. This trend will be stronger to continue if the candle can stay above the 95,000-100,000 level, so it is assumed that it will test the strength of Uniswap (UNI) from the resistance of 140,000-180,000.
5 Bearish Crypto Assets
1. Efforce (WOZX)

It touched the price of 700 and passed the EMA/200 but failed to stay above the 710 level, making Efforce (WOZX) continue to weaken in price. Even though the current trend has moved away from the oversold zone, it does not significantly impact prices.
2. DAD (DAD)

DAD (DAD) price continues to show weakness as several support levels cannot hold candles such as 600 and 300-420. The trend will try to stay above the 130-140 area. If this level is able to be passed, then DAD (DAD) will become stronger in the downtrend phase.
3. Glitch (GLCH)

When using a chart on the 1 Day timeframe, Glitch (GLCH) has been in a bearish trend since February 11, 2022, where the price has weakened by more than 80%. Glitch (GLCH) price movements need momentum to continue weakening or improving the trend.
4. DFI.Money (YFII)

Currently, DFI.Money (YFII) is in a bearish sideways phase with prices moving from 12,000,000 to 15,000,000. If one of the prices can be passed, it will determine the direction of the next movement of DFI.Money (YFII).
5. TitanSwap (TITAN)

The Bollinger Bands indicator still indicates that TitanSwap (TITAN) has not gotten out of the bearish sideways zone and still needs further time to confirm the trend movement. Resistance TitanSwap (TITAN) is available at 120 and 150.
NOTES:
If EMA 5 crosses the WMA 75, 85, and EMA 200 lines, and these lines intersect from bottom to top, then the market trend tends to be upward (bullish).
Each table above shows that when the value of EMA 5 is higher than WMA 75,85 and EMA 200, the market tends to rise (bullish).
If the RSI and MACD values show the same condition, the market is showing the same trend; an overbought (overbought) or oversold (oversold) condition indicates that the market is at the point of changing trend direction.
 Market

