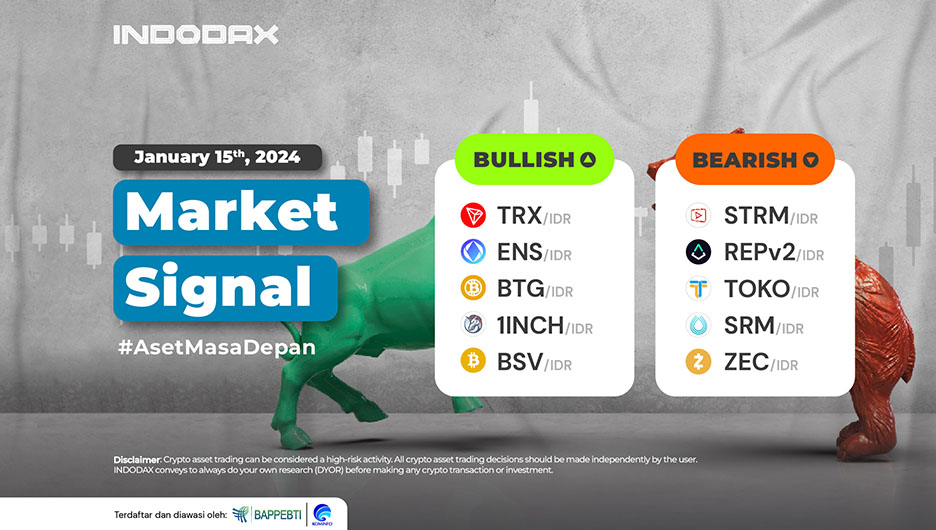
The positive trend of crypto assets in the third week of 2024 was led by Tron (TRX), Ethereum Name Service (ENS), and Bitcoin Gold (BTG).
Curious about what crypto assets are experiencing bullish or bearish trends this week? Check out the full INDODAX Market Signal update below!
5 Bullish Crypto Assets
1. Tron (TRX)

The price of Tron (TRX) moved quite massively, where the bullish trend had a positive impact on the price increase of Tron (TRX) on the 1-day chart. The correction in Tron (TRX) managed not to exceed the 1,480-1,550 area, increasing the possibility of Tron (TRX) crossing the dominant resistance area around 1,670-1,750.
2. Ethereum Name Service (ENS)

Ethereum Name Service (ENS) has been in the bullish zone since January 3, 2024, which has impacted the price of Ethereum Name Service (ENS), which has increased by more than 90%. Ethereum Name Service (ENS) even touched the 830,000 level, the highest price of Ethereum Name Service (ENS) since it was traded at INDODAX. Therefore, the price of Ethereum Name Service (ENS) will have the potential to continue strengthening if the candle can move above the WMA/85.
3. Bitcoin Gold (BTG)

The strengthening of the bullish trend of Bitcoin Gold (BTG) will further dominate if candles can be created above the 420,000-450,000 zone, where if this assumption is created, Bitcoin Gold (BTG) has the opportunity to be in the oversold area on the RSI indicator.
4. 1Inch (1INCH)

Successfully crossing several resistance levels, such as 4,700-5,200 and 6,000-6,600, indicates that positive pressure dominates the 1Inch (1INCH) trend change. The weakening of the 1INCH trend, if it occurs, will try to test the strength of the price of 6,300-7,000.
5. Bitcoin SV (BSV)
 Bitcoin SV (BSV) is in a bullish trend after successfully crossing the EMA/200, which can continue to strengthen and confirm the change in the trend movement of Bitcoin SV (BSV). The bullish trend will continue to dominate if the 1,100,000-1,200,000 area is not crossed.
5 Bearish Crypto Assets
1. StreamCoin (STRM)

A bearish sideways trend is holding back the movement of StreamCoin (STRM). This is reinforced by the MACD indicator, which illustrates the same thing. The two lines of the MACD indicator will be able to cross each other if one of the 30-75 level areas can be broken and will confirm the price movement of StreamCoin (STRM).
2. Augur v2 (REPv2)

Although the candle moved above the WMA/85, the price could not move volatile. This is inseparable from the inability of the candle to form above the 16,100-22,000 level, with the expectation that if this is realized, then the potential for Augur v2 (REPv2) to strengthen is quite large.
3. Tokoin (TOKO)
 The candle movement indicates that the Tokoin (TOKO) trend is in a negative direction, but currently, the price is moving below the WMA/75. If Tokoin (TOKO) can break from level 28, then the movement of Tokoin (TOKO) will be more positive and suppress the bearish trend.
4. Serum (SRM)

On the 4-hour timeframe, Serum (SRM) is assumed to stay above the support level of 1,500-2,400 because if the trend passes this level, the bearish trend of Serum (SRM) will potentially experience pressure.
5. Zcash (ZEC)

The MACD indicator indicates that the Zcash (ZEC) trend is in a positive direction. However, the price is currently moving above the WMA/75. If Zcash (ZEC) can break from the 500,000-550,000 area, the bearish trend can fail to resume.
NOTES:
If EMA 5 crosses the WMA 75, 85, and EMA 200 lines, and these lines intersect from bottom to top, then the market trend tends to be upward (bullish).
Each table above shows that when the value of EMA 5 is higher than WMA 75,85 and EMA 200, the market tends to rise (bullish).
If the RSI and MACD values show the same condition, the market is showing the same trend; an overbought (overbought) or oversold (oversold) condition indicates that the market is at the point of changing trend direction.
 Market

