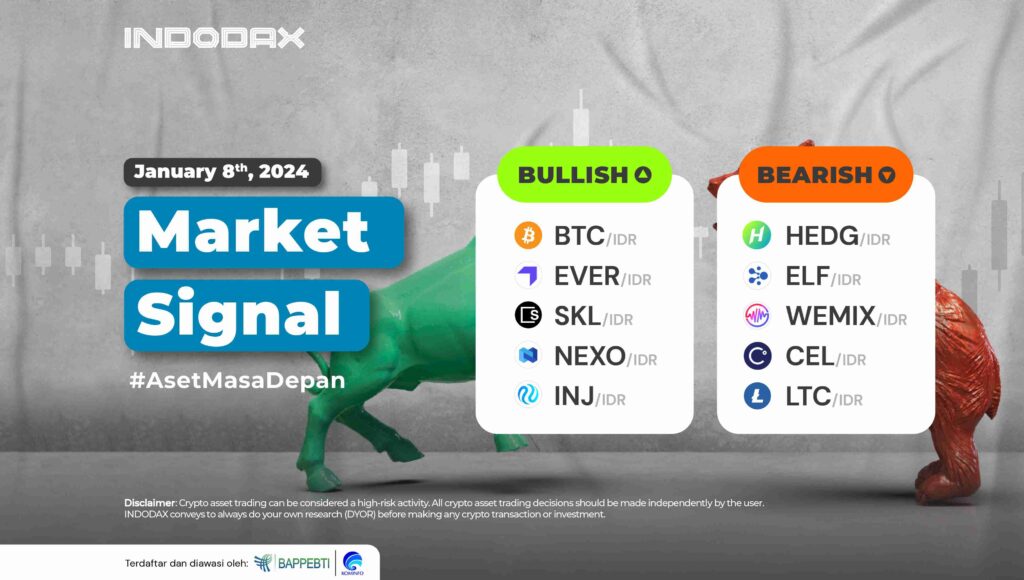
Bitcoin (BTC) is back with a positive trend starting the second week of 2024 with crypto asset investment opportunities for #AsetMasaDepan.
Curious about which crypto assets are experiencing bullish or bearish trends this week? Check out the complete INDODAX Market Signal update below!
5 Bullish Crypto Assets
1. Bitcoin (BTC)

The price of Bitcoin (BTC) in the 1-day movement still indicates that the current trend is still in the uptrend phase. However, the MACD indicator predicts that Bitcoin (BTC) will move in the sideways zone, with the trend confirmed to fluctuate if it can penetrate the 630,000,000-715,000,000 area.
2. Everscale (EVER)
 Everscale (EVER) experienced a correction after the trend could not maintain above level 740, but Everscale (EVER) could pull back even though it passed EMA/200. This was driven by the absence of candles forming below the 480-500 area. The bullish trend will be stronger and continue if a candle is able to be created above the 900-1,000 level.
3. SKALE (SKL)

The potential for SKALE (SKL) to weaken after experiencing a strengthening of more than 100% is quite wide open. One indication of SKALE (SKL) weakness is depicted by MACD, where the trend is in the negative zone. Weakness will lead to the support range area of 900-1,100.
4. Nexo (NEXO)

Being in a bullish phase since November 23, 2023, the price of Nexo (NEXO) has experienced a correction but is still at WMA/85, which creates positive momentum pushing the price of Nexo (NEXO) to strengthen potentially. The strengthening that occurs will provide an indication of heading to the 15,000-18,000 area.
5. Injective (INJ)

The price weakening in Injective (INJ) was inseparable from the trend away from the overbought area. However, the weakening was insignificant, indicating that the bullish trend momentum still dominated Injective (INJ). The support area of 470,000-540,000 will be an indication for Injective (INJ). If this area is crossed, WMA/85 will experience negative pressure.
5 Bearish Crypto Assets
1. HedgeTrade (HEDG)

The decline in HedgeTrade (HEDG) is quite deep, but the MACD indicator also shows that the trend is in a negative sideways phase. This made HedgeTrade (HEDG) touch its lowest price level since listing on INDODAX. The potential for HedgeTrade (HEDG) to correct price weakness will be created if the trend can strengthen beyond WMA/85.
2. Aelf (ELF)

The price of Aelf (ELF) experienced a drop after the RSI indicator indicated that the trend was in the overbought area. This has the impact of changing the trend to bearish. If the support area of 6,300-7,900 is broken, then the bearish trend will continue.
3. WEMIX (WEMIX)

A bearish trend was confirmed on WEMIX (WEMIX) after the 45,000-50,000 area was passed, followed by a candle moving below the EMA/200. The two Bollinger Bands indicator lines describe narrowing each other. It can be estimated that the price of WEMIX (WEMIX) will move to 38,000-46,000.
4. Celsius (CEL)

The MACD indicator showed the Celsius (CEL) trend that occurred in a positive direction after the line could cross upwards. Still, the price strengthening in Celsius (CEL) was not very significant because the price could not strengthen and pass the 3,400 level.
5. Litecoin (LTC)

The downtrend phase currently occurring in Litecoin (LTC) on the 4-hour chart will be able to correct the price weakness if it can end the bearish sideways phase of 1,000,000-1,040,000 with positive results.
NOTES:
If EMA 5 crosses the WMA 75, 85, and EMA 200 lines, and these lines intersect from bottom to top, then the market trend tends to be upward (bullish).
Each table above shows that when the value of EMA 5 is higher than WMA 75,85 and EMA 200, the market tends to rise (bullish).
If the RSI and MACD values show the same condition, the market is showing the same trend; an overbought (overbought) or oversold (oversold) condition indicates that the market is at the point of changing trend direction.


