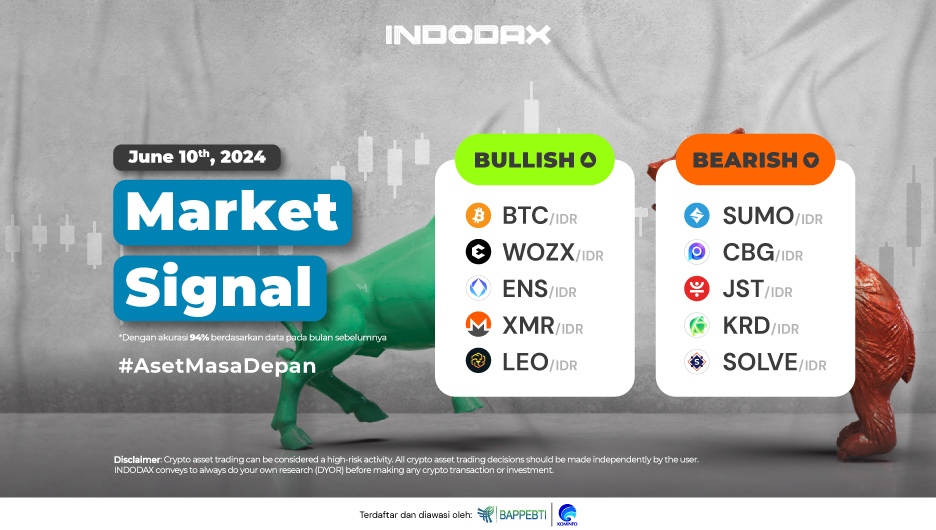
This week, the bullish crypto asset lineup is led by Bitcoin (BTC) in the first position, and followed by Efforce (WOZX) and Ethereum Name Service (ENS).
Want to know the performance of your favorite crypto assets? Check INDODAX Market Signal below!
5 Bullish Crypto Assets
1. Bitcoin (BTC)

The use of the 4-hour timeframe indicates that Bitcoin (BTC) is currently weakened by the WMA/75 line. If Bitcoin (BTC) can maintain a candle above the line, it will increase the possibility of Bitcoin (BTC) breaking 1,150,000,000-1,170,000,000, so Bitcoin (BTC) will touch the latest high.
2. Efforce (WOZX)

A successful break of the EMA/200 followed by the 100-120 area can form a candle with a complete position, resulting in a fairly positive price change for Efforce (WOZX). The bullish trend will increasingly dominate the trend change of Efforce (WOZX) if the price of 480-560 can be broken.
3. Ethereum Name Service (ENS)

The inability to pass the price of 475,000-500,000 has created negative pressure that has an impact on weakening the price of Ethereum Name Service (ENS). Weakening prices will test the strength of the 280,000-320,000 Support area if broken, it will allow the WMA/85 to be broken.
4. Monero (XMR)

Being in a Bullish trend since May 11, 2024, has a positive impact on changes in the price of Monero (XMR) with prices having strengthened more than 30%. The trend can form a candle above the dominant resistance in the 2,700,000-2,800,000 area which allows the bullish trend to continue.
5. Unus Sed Leo (LEO)

The trend movement of Unus Sed Leo (LEO) will be quite dynamic, the Bollinger Bands indicator will predict the same but if it can break positively above the available line it will make the rate of change even higher, with Resistance in the 105,000-115,000 area.
5 Bearish Crypto Assets
1. Sumokoin (SUMO)

Price weakness continues to be shown by Sumokoin (SUMO), although it touched a price of around 234 which is the highest price of Sumokoin (SUMO) during 2024, the trend has weakened again. Positive momentum will be created with 125-155 area that can be broken and will be followed by MACD indicator confirmation.
2. Chainbing (CBG)

Chainbing (CBG) is currently still indicated to be unable to move from the Bearish Sideways phase, the absence of momentum makes the price of Chainbing (CBG) move stagnantly. The current trend is still under WMA/75 pressure making the possibility of CBG weakening quite large, but if the Candle can form above the 2,700-3,600 Sideways area will end positively.
3. JUST (JST)

The movement of the DASH trend on the 4-Hour chart, currently indicated is still in the Bearish phase with price movements still held by EMA/200 so it is difficult for the trend to move up. Opportunities for JUST (JST) to break through EMA/200 can be wide open, Resisitance 555-625 must be broken.
4. Krypton DAO (KRD)

On the 1-Day time frame Krypton DAO must be able to stay above the Support level of 10,000-12,000 because if the price passes this level, the Bearish trend will increasingly dominate price changes, and vice versa if it manages to stay above this level it will allow Krypton DAO (KRD) to stay above the WMA/85.
5. Solve (SOLVE)

The breakout of the 360 – 385 area was the beginning for Solve (SOLVE) to weaken before it was confirmed by the WMA / 85 which broke below the EMA / 200 signaling that the Bullish trend was over. Solve (SOLVE) Support area indicated available at 255-260, if the area is passed Solve (SOLVE) will touch its lowest level.
NOTES:
If the EMA 5, crosses the WMA 75, 85 and EMA 200 lines, and the lines intersect from bottom to top, then the market trend is upward (bullish).
Each table above shows that if, the value of EMA 5 is higher than WMA 75, 85 and EMA 200, then the market is trending up (bullish).
If the RSI and MACD values show the same condition, it means that the market is showing the same trend, overbought (overbought), or oversold (oversold) conditions are one indicator that the market is at the point of changing the direction of the trend.


 Polkadot 9.66%
 BNB 0.78%
 Solana 4.89%
 Ethereum 2.37%
 Cardano 1.22%
 Polygon Ecosystem Token 2.16%
 Tron 2.84%
 Market


