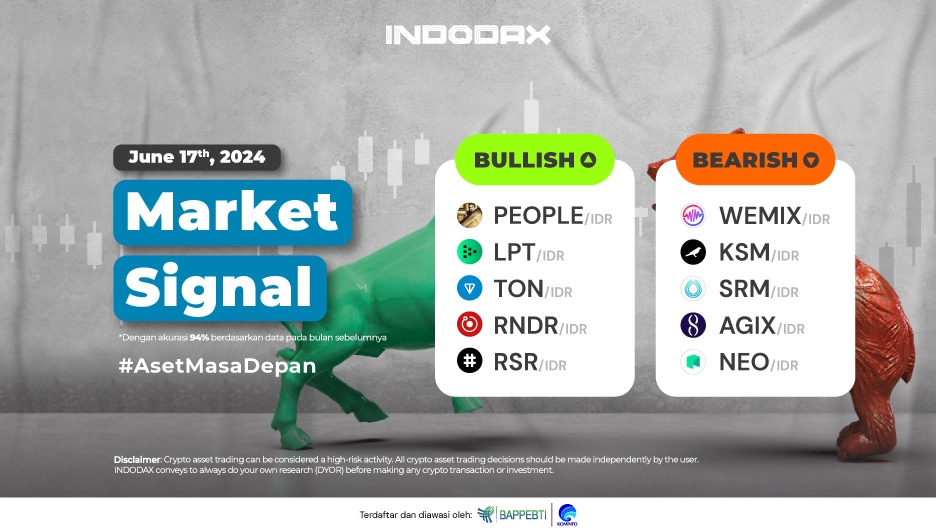
This week, the bullish crypto asset lineup is led by ConstitutionDAO (PEOPLE) in the first position, and followed by Livepeer (LPT) and Toncoin (TON).
Want to know the performance of your favorite crypto assets? Check INDODAX Market Signal below!
5 Aset Kripto Bullish
1. ConstitutionDAO (PEOPLE)

Managed to end the Sideways Bearish phase at 350 – 500 positively, making the trend switch to Bullish so that the price of ConstitutionDAO (PEOPLE) can be pushed up more than 150%. The nearest support is at 1,600 – 1,750 if this support is broken then it allows the trend to test the EMA/200.
2. Livepeer (LPT)

The trend shows that Livepeer (LPT) switched from previously Bearish to Bullish since May 12, 2024, with the price having turned positive by more than 20%. Currently Livepeer (LPT) is held back by the EMA/200, with the 300,000 – 340,000 area being quite important if it can be broken then it is possible for the EMA/200 to follow similarly
3. Toncoin (TON)

Toncoin (TON) is able to show a promising performance, where since listing on Indodax Toncoin (TON) has strengthened more than 50%. The trend is estimated to be in a negative area, with a fairly dominant SUpport area around 110,000 – 120,000.
4. Render Token (RNDR)

177,000 – 215,000 being a strong area for Render Token (RNDR), the trend was unable to break the area and experienced a correction. If the weakness continues to make the trend break through a fairly wide area of 100,000 – 133,000 will make Render Token (RNDR) break the EMA/200 so that it will allow the Bullish phase to fail to continue.
5. Reserve Rights (RSR)

Still in the Bullish trend but the price was unable to correct the weakening trend, the candle did not manage to form above the 140 -160 area causing a correction could not be avoided. The chance of a Bearish Phase to occur will be higher, if the trend cannot stay above the level of 70 – 95.
5 Aset Kripto Bearish
1. WEMIX (WEMIX)

On the 1-Day chart used, WEMIX has experienced a deep weakening, since switching to a Bearish trend the price has corrected around 30%. 12,000 – 16,000 is a fairly strong Support area, if the area is broken, it is estimated that Bearish will become strong and dominate price changes.
2. Kusama (KSM)

After being confirmed to be in the Downtrend phase, Kusama (KSM) is currently estimated to be experiencing Sideways with a price movement range of 420,000 – 560,000 if Support is broken, Kusama (KSM) has a chance to go to the price of 350,000 but on the contrary if the price moves positively it will be able to press the EMA/200.
3. Serum (SRM)

The Serum (SRM) trend depicted by the 1-Day chart is known if the price has corrected quite significantly, where since being traded on Indodax Serum (SRM) has weakened by more than 90%. Trend has made the price touch its lowest price, this has the potential to be recreated if the price of 500 is broken.
4. SingularityNET (AGIX)

Bearish trend made Support 12,600 – 14,000 broken and made Bearish increasingly dominate price changes. The Bearish phase is expected to be stronger to continue with prices will try to test the strength of the 7,400 – 9,500 level.
5. Neo (NEO)

Trend is unable to move above EMA/200 making NEO prices experience further correction. Bearish will experience negative pressure if the candle is able to form above the 250,000 – 270,000 area must also be followed by the EMA/200 which can be broken so that the price will go towards the 290,000 level.
NOTES:
If the EMA 5, crosses the WMA 75, 85 and EMA 200 lines, and the lines intersect from bottom to top, then the market trend is upward (bullish).
Each table above shows that if, the value of EMA 5 is higher than WMA 75, 85 and EMA 200, then the market is trending up (bullish).
If the RSI and MACD values show the same condition, it means that the market is showing the same trend, overbought (overbought), or oversold (oversold) conditions are one indicator that the market is at the point of changing the direction of the trend.


 Polkadot 8.90%
 BNB 0.83%
 Solana 4.89%
 Ethereum 2.37%
 Cardano 1.18%
 Polygon Ecosystem Token 2.18%
 Tron 2.84%
 Market


