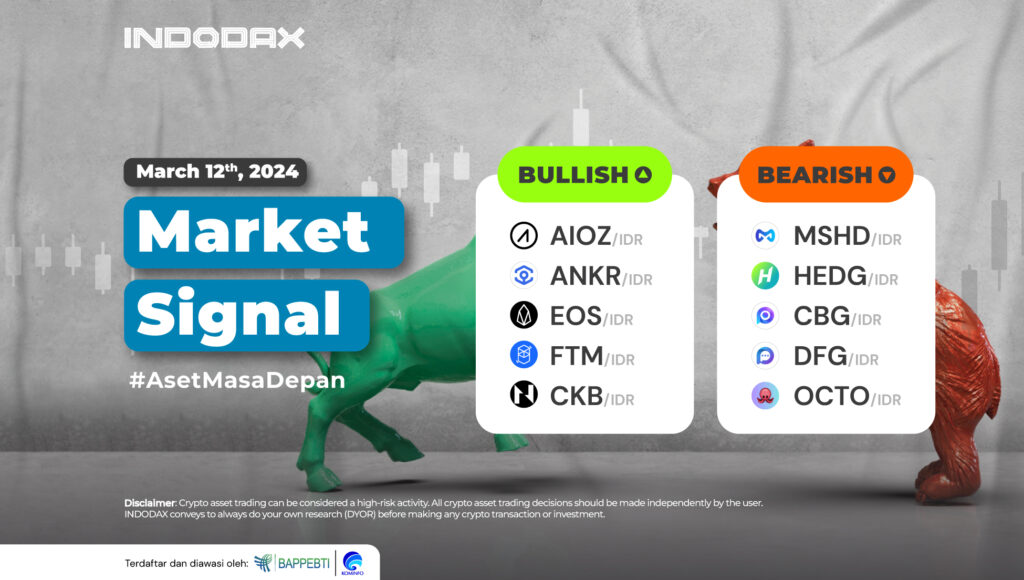
Entering the second week of March 2024, AIOZ Network (AIOZ) and Ankr (ANKR) are leading the ranks of crypto assets on a bullish trend.
Curious about what crypto assets are experiencing bullish or bearish trends this week? Check out the full INDODAX Market Signal update below!
5 Bullish Crypto Assets
1. AIOZ Network (AIOZ)

AIOZ Network (AIOZ) bullish trend on the 1-Day timeframe makes positive momentum dominate enough so that prices can continue to strengthen. The current trend is estimated by the MACD indicator to still be in a positive trend. This will support the AIOZ Network (AIOZ) in testing the resistance area available at 10,800-14,000. Although the available price range is quite wide, if it can be broken, it will be an opportunity for AIOZ Network (AIOZ) to touch the All Time High (ATH).
2. Ankr (ANKR)

Ankr (ANKR)’s strength and current bullish trend are still being held back by the 800-1,100 area, which has yet to be broken. If this area is successfully passed, the next resistance is at the level of 1,425-2,000.
3. EOS (EOS)

The EOS (EOS) candle managed to cross and hold above the EMA/200, and the trend managed to indicate bullish after a deep decline since touching its highest price in the 220,000 range. Holding above the 20,500 resistance could indicate that EOS (EOS) could reach the next level at 28,500-30,000.
4. Fantom (FTM)

The chart movement on the 1-Day timeframe shows an increasingly strong bullish phase of Fantom (FTM), where quite dominating resistance levels such as 8,000-9,800 could be broken. Fantom (FTM) is trying to go to the 15,000-20,000 level area to test the area.
5. Nervos Network (CKB)

Nervos Network (CKB) entered the bullish zone on February 3, 2024, which then positively impacted the price change of Nervos Network (CKB), which has strengthened by more than 200%. If the price level of 455-555 can be passed, it is estimated that Nervos Network (CKB) will more easily touch the All Time High (ATH).
5 Bearish Crypto Assets
1. MASHIDA (MSHD)

Since listing on INDODAX on March 30, 2023, MASHIDA (MSHD) has continued to experience a fairly deep weakening. Having touched the price of 209, now MASHIDA (MSHD) has never returned to that level. Although the trend is indicated to move positively by candles above the WMA / 85, this does not have a high enough effect on MASHIDA (MSHD) price movements, with resistance available in the 66-75 area.
2. HedgeTrade (HEDG)

On the bearish trend, HedgeTrade (HEDG) has been unable to suppress it, so it continues. The absence of positive price volatility drives this, and the dominant resistance at the 400 level is untouched.
3. Chainbing (CBG)

There was quite a high Chainbing (CBG) price fluctuation, but this was not supported by momentum and massive selling pressure, so Chainbing (CBG) could not end the bearish trend. Chainbing (CBG) price is still testing the WMA/85 resistance.
4. Defigram (DFG)

Defigram (DFG) broke the EMA/200 with a candle that formed quite positively, but the absence of the next candle created above the price of 40,000 made Defigram (DFG) weaken again and continue the trend that occurred.
5. OctoFi (OCTO)

Bollinger Bands can identify the OctoFi (OCTO) price as being in a bearish sideways phase with a movement range of 5,110-7,900. If the support does not hold the price weakness, OctoFi (OCTO) will touch its weakest price.
NOTES:
If EMA 5 crosses the WMA 75, 85, and EMA 200 lines, and these lines intersect from bottom to top, then the market trend tends to be upward (bullish).
Each table above shows that when the value of EMA 5 is higher than WMA 75,85 and EMA 200, the market tends to rise (bullish).
If the RSI and MACD values show the same condition, the market is showing the same trend; an overbought (overbought) or oversold (oversold) condition indicates that the market is at the point of changing trend direction.


