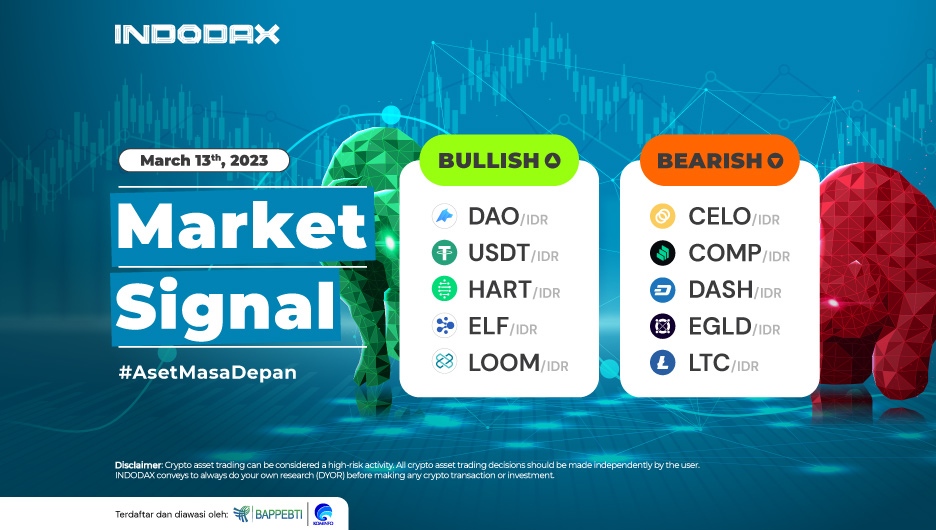
Hello Indodax members! This week, what are the bullish and bearish indications of crypto assets? Check out the following article and get the information!
5 Bullish Crypto Assets
1. Dao Maker (DAO)

It strengthened quite enormously and dynamically until it penetrated EMA/200 after holding above the Support area of 14,100 – 16,000, creating positive momentum so that it was able to change the trend from Bearish to Bullish.
It had weakened to the level of 20,000, but the price resumed strengthening in the direction of the trend.
Being able to hold above WMA/75 would indicate DAO to test 27,000 – 32,300 levels.
2. USDT (USDT)

It weakened and touched the range of 14,865, USDT’s lowest price since September 2022.
The bullish phase can be confirmed after the price can stay above the support level area of 15,100 – 15,170.
If USDT can break the resistance area of 15,600 – 15,655, it will make USDT’s position even stronger.
3. Hara Token (HART)

If you look at one of the indicators used, MACD, it is estimated that Hara Token is in a negative zone because the two lines have crossed downwards.
However, the weakening will be more limited, and HART has penetrated the 43-45 area, so it will have positive momentum to form a candle with a complete shape above the 50-level range.
The weakening will test the strengthening of the Support levels 41 – 35.
4. Aelf (ELF)

On March 12, 2023, Aelf once touched the price of around 6,500, but the price declined again. This price was ELF’s highest price since April 23, 2022.
It will try to stay above the 3,000 – 3,670 area if the weakening occurs. If the price can stay above that level, it will increase Aelf’s indication to strengthen again.
5. Loom Network (LOOM)

The Loom Network strengthens when the trend can rebound from the Support level, which is quite dominant at 590 – 605, and then can move above WMA/85 so that it is followed by the momentum of changing the direction of the trend to an Uptrend.
The MACD indicator indicates that LOOM is in the direction of a negative trend on the 4-hour chart, but if it weakens, it will try to test WMA/85. A break of this line will push the Support level to 660 – 755.
5 Bearish Crypto Assets
1. Celo (CELO)

On the 1-day chart, it can be indicated that CELO has been in the Bearish zone for quite a long time, namely January 17, 2022. The weakening since the Bearish trend occurred until now is quite deep, up to around 75%.
The Bollinger Bands indicator illustrates if the two lines are far from each other, thus indicating that Celo will move more volatile.
A dynamic trend movement will create opportunities for strength and weakness wide open. If it strengthens, it will move past the 13,800 – 17,300 level, while reversing with this assumption, the weakening will test the 6,300 – 7,300 area.
2. Compound (COMP)

Staying above WMA/75 and WMA/85 indicates continuing the bullish trend, but the bullish trend can be broken. The weakening of the COMP price makes several support levels broken, such as 750,000 and 700,000 – 726,000.
Strengthening the COMP will try to break the Resistance level, available in 680,000 – 770,000.
3. DASH (DASH)

DASH continues to weaken in price. This is directly proportional to the current trend, which is Bearish.
It touched the 682,000 price range, DASH’s lowest price since January 2023.
An improvement in the trend on DASH will be realized, starting with a strengthening movement. If there is a candle above WMA/85, then this must be followed by passing several resistance levels, such as 838,000 – 886,000 and 920,000 – 1,010,000.
4. Elrond (EGLD)

Strengthened and penetrated the Resistance line in the area of 630,000 – 750,000 so that the indication to thwart the Bearish trend was getting bigger, but the Candle could not stay above EMA/200 in EGLD weakening again and continuing the Bearish trend.
The weakening of the trend will test the strength of the Support level, which is 500,000 – 560,000.
5. Litecoin (LTC)

Not being able to stay above the support level of 1,300,000 – 1,400,000 confirmed LTC to be in a new phase, namely Downtrend, where the weakening that has occurred since LTC was in the Bearish phase until now is around 15%.
The RSI indicator shows that if the current trend is in the oversold zone, this is reasonable because the weakening that has occurred is deep enough. The negative momentum will become more potent if the movement weakens beyond the support line, around 970,000.
NOTE: If the 5 EMA crosses the WMA 75, 85 and 200 EMA lines and the lines intersect from the bottom up, then the market trend tends to go up (bullish), each table above shows that if the 5 EMA value is higher than the 75.85 WMA and 200 EMA, the market tends to go up (bullish).
If the RSI and MACD values ??show the same condition, it means that the market is showing the same trend. Overbought or oversold conditions are an indicator that the market is already at the point of changing direction of a trend.
ATTENTION: All contents which includes text, analysis, predictions, images in the form of graphics and charts, as well as news published on this website, is only used as trading information, and is not a recommendation or suggestion to take action in transacting either buying or selling. certain crypto assets.
All crypto asset trading decisions are independent decisions by the users. Therefore, all risks arising from it, both profit and loss, are not the responsibility of INDODAX.


 Polkadot 9.84%
 BNB 0.46%
 Solana 4.45%
 Ethereum 3.12%
 Cardano 1.76%
 Polygon Ecosystem Token 2.67%
 Market


