Solana (SOL) is back and leading in the ranks of crypto assets on a bullish trend this week, followed by AIOZ Network (AIOZ), which has continued since last week.
Curious about what crypto assets are experiencing bullish or bearish trends this week? Check out the full update on INDODAX Market Signal below!
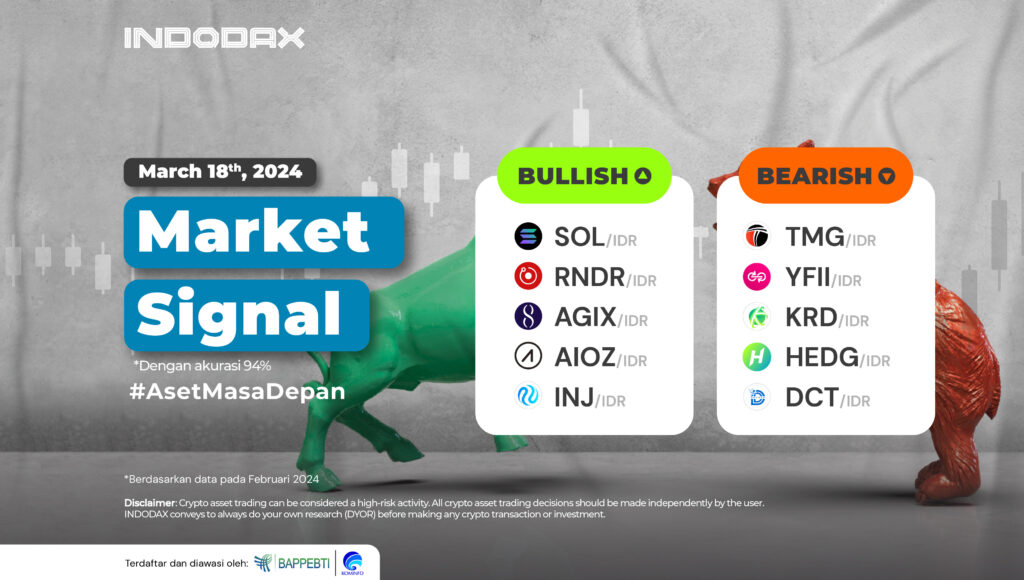
5 Bullish Crypto Assets
1. Solana (SOL)
 Solana’s (SOL) price strength in the 1-day timeframe is very positive after resistance in a fairly wide area of 1,650,000-2,000,000 was broken to create new support. A correction in Solana (SOL) could occur. The RSI has indicated that the current trend is overbought, with the closest support being the 2,400,000-2,600,000 area.
2. Render Token (RNDR)

The strengthening of Render Token (RNDR) is quite high. Since being in the uptrend zone, Render Token (RNDR) has strengthened by more than 400%. Currently, Render Token (RNDR) is estimated that the MACD indicator is in a negative area but requires further time with the nearest support area at 127,000-157,000.
3. SingularityNET (AGIX)

When the price reached 23,400, the trend of SingularityNET (AGIX) decreased. However, it was identified that the bullish trend is still running. The bullish trend is expected to fail to continue if there is a massive weakening to test the 3,760-6,000 area.
4. AIOZ Network (AIOZ)

Ending the sideways phase positively, then supported by candles holding above the 500 support, resulted in the end of the AIOZ Network (AIOZ) trend from bearish to bullish. A candle holder above the 10,000 level will increase the chances of AIOZ Network (AIOZ) breaking in the 15,000-20,000 area.
5. Injective (INJ)

In the 1-day timeframe, Injective (INJ) showed a positive change in trend that pushed the bullish phase to dominate the price—touching its highest level again and testing the 85,000 level but failing to break through, causing the price of Injective (INJ) to weaken to head towards the 490,000-670,000 area.
5 Bearish Crypto Assets
1. T-mac DAO (TMG)

The two lines on the Bollinger Bands are close together, indicating that T-mac DAO (TMG) is currently in a sideways phase. The 20,000-27,000 movement range at this level is crucial for T-mac DAO (TMG), which could be one of the signs of a new direction forming.
2. DFI.Money (YFII)
 Successfully touching the highest price of DFI.Money (YFII) since November 2022 brought a deep negative change in the price of DFI.Money (YFII) has decreased by more than 50% compared to the 53,000,000 level—the trend of DFI.Money (YFII) is expected to weaken if there is no strength to hold above the 6,000,000-9,000,000 area.
3. Krypton DAO (KRD)

The MACD indicator showing a negative crossover significantly impacted Krypton DAO (KRD). The price of Krypton DAO (KRD) weakened and could not form a candle above the 22,000 level, where there is currently an indicated support area at 10,000-12,500.
4. HedgeTrade (HEDG)

HedgeTrade (HEDG) created a positive movement that pushed the candle to form above the WMA/85. It will take more time for HedgeTrade (HEDG) to suppress the bearish trend, but the formation of a candle above the 370-450 area could indicate the strengthening of HedgeTrade (HEDG).
5. Degree Crypto Token (DCT)

The weakening price of Degree Crypto Token (DCT) is influenced by the bearish trend that suppresses the price and the absence of buyer power to make Degree Crypto Token (DCT) move above the 700,000 level. The trend does not move volatile, where price changes are only stagnant; the MACD indicator illustrates the same.
NOTES:
If EMA 5 crosses the WMA 75, 85, and EMA 200 lines, and these lines intersect from bottom to top, then the market trend tends to be upward (bullish).
Each table above shows that when the value of EMA 5 is higher than WMA 75,85 and EMA 200, the market tends to rise (bullish).
If the RSI and MACD values show the same condition, the market is showing the same trend; an overbought (overbought) or oversold (oversold) condition indicates that the market is at the point of changing trend direction.
 Market

