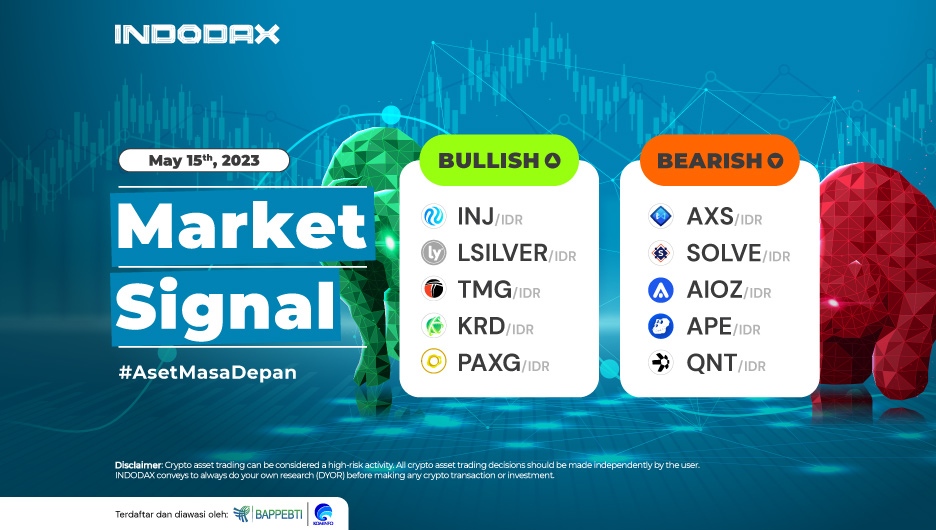
Hello INDODAX traders! In the third week of May 2023, the crypto market is experiencing a significant bullish trend, especially in Injective (INJ) and Lyfe Silver (SILVER) crypto assets.
This trend provides great opportunities for traders who want to make a profit.
Let’s look at the information below so you can make the right trading decisions and make profits more effectively.
5 Bullish Crypto Assets
1. Injective (INJ) Coin

141,300 – 145,000 is the price that INJ coin can reach before experiencing a correction, indicating a trend away from the Overbought area on the RSI indicator. The weakening of the trend will lead to a support level of 60,000 – 72,000.
2. Lyfe Silver (LSILVER) Coin

Being in the Bearish phase since January 14, 2022, then Candle was able to Break the Resistance area, which was quite strong in the range of 9,000 – 9,700, creating positive momentum and pushing the price of Lyfe Silver coin (Lsilver to IDR) to continue strengthening until it is in a Bullish trend.
If the price continues to be able to continue strengthening, it will indicate to go to the 13,200 – 15,400 area.
3. T-mac DAO (TMG)

The bullish trend at TMG on the 4-hour time frame is getting stronger after the correction to stay above the support level of 79,800 – 91,300, making the price continue to strengthen in line with the current trend.
4. Krypton DAO (KRD) Coin

The MACD indicator indicates the current trend is negative after the two lines cross downwards.
The bullish trend will experience pressure if the Candle weakens to move below WMA/75.
5. Pax Gold (PAXG)

Even though the price weakened until it passed EMA/200, the trend experienced a pullback to continue strengthening again, a trend illustrated by the MACD indicator strengthening, which occurred to touch the level of the 32,000,000 areas.
This indicates that if PAXG succeeds in breaking the resistance level around 32,000,000, a bullish trend will create a new resistance level.
5 Bearish Crypto Assets
1. Axie Infinity (AXS) Coin

The price movement of Axie Infinity (AXS to IDR) in the 1-day time frame continues to weaken because supply pressure dominates demand, so Axie Infinity cannot be separated from negative momentum.
The indicated support area is available around 90,000 – 95,000; if the price cannot stay above this level, the Bearish trend will strengthen.
2. Solve (SOLVE) Coin

The decline in Solve is quite deep, but the trend is not yet in the Overbought zone on the RSI indicator. The support area that dominates is in the range of 310 – 340.
3. AIOZ Network (AIOZ)

The trend that occurs is shown by the MACD indicator in a positive direction. Still, the strengthening of prices at AIOZ is not too significant because this has yet to be followed by a candle that cannot move higher above WMA/85.
4. ApeCoin (APE) Coin

The ongoing downtrend on APE on the 1-day chart will fail to continue the direction of the next trend movement if the Candle can break in the 76,600 – 90,300 area range.
5. Quant (QNT) Coin

Quant (QNT) Coin QNT has been in the Bearish zone since April 20, 2023, but it is assumed that Quant is still holding above the Support area of 1,336,000 – 1,620,000. If this level is not passed, the potential for QNT to strengthen again and end the Downtrend phase will be quite large.
How did you get the picture? Come on, visit Indodax immediately, and take advantage of the opportunity to gain significant profits in the Indonesian crypto market! And start becoming a successful trader by utilizing the services of INDODAX.
Note: If the EMA 5 crosses the WMA 75, 85, and EMA 200 lines and these lines intersect from the bottom up, then the market trend tends to be up (bullish); each table above shows if the EMA 5 value is higher than WMA 75, 85 and EMA 200, the market tends to rise (bullish).
Suppose the RSI and MACD values show the same condition. In that case, the market is showing the same trend. The condition is overbought (overbought) or oversold (oversold), which indicates that the market is at the point of changing the trend direction.
Attention: All content which includes text, analysis, predictions, images in the form of graphics or charts, as well as news published on this website, is only used as trading information and is not a suggestion or suggestion to take action in a transaction, either buying or selling certain crypto assets.
All crypto asset trading decisions are independent decisions by users. Therefore, all risks arising from it, both profit and loss, are not the responsibility of INDODAX.


