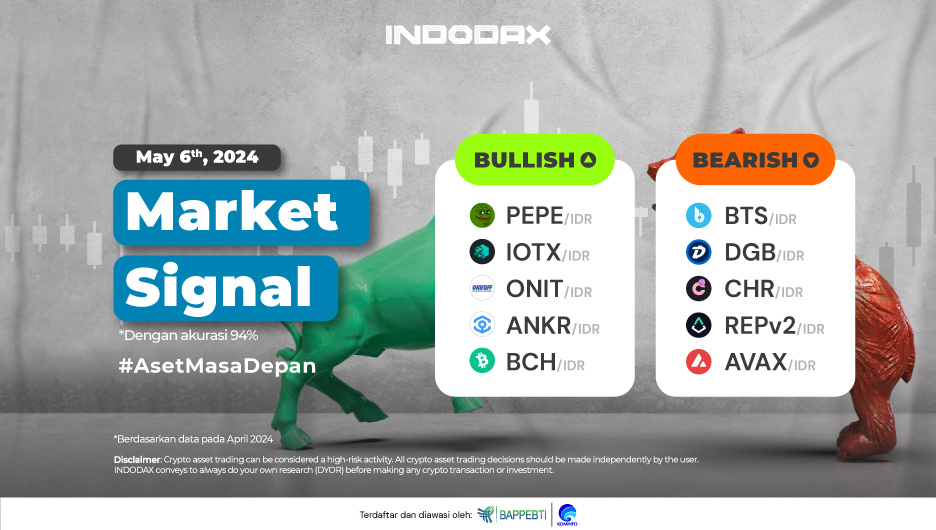
This week’s bullish trend is occupied by Pepe (PEPE) to Bitcoin Cash (BCH) with green market signals.
Curious about what crypto assets are experiencing bullish or bearish trends this week? Come on, check out the full INDODAX Market Signal update below!
5 Bullish Crypto Assets
1. Pepe (PEPE)
 The 0.15-0.17 area is an area that, if Pepe (PEPE) can pass, it is estimated that the bullish trend will increasingly dominate, and the opportunity for prices to move positively is quite large. However, if weakness occurs, it is estimated that the price of Pepe (PEPE) will go to the 0.11-0.125 area.
2. IoTeX (IOTX)

On the 1-Day chart, the IoTeX (IOTX) trend can be held by the 750-850 support after price weakness occurs. One of the indicators used, namely MACD, indicates that currently, IoTeX (IOTX) needs more time to confirm the direction of the next price movement, with an estimate that if it can break the 1,100 level, it is possible to hold above the WMA/85.
3. ONBUFF (ONIT)

ONBUFF (ONIT) is assumed to still be on a bullish path, but this will not be able to continue if the price range of 385-460, which is the support, cannot withstand price weakness and will negatively pressure ONBUFF (ONIT).
4. Ankr (ANKR)

Ankr (ANKR) price movement is estimated by the Bollinger Bands indicator if the price can change volatile enough. Holding the candle above the WMA/85 will make Ankr (ANKR) go to the 900-1,000 range.
5. Bitcoin Cash (BCH)

Although Bitcoin Cash (BCH) is currently in the bullish zone, the failure of the candle to form above the WMA/75 will put negative pressure on Bitcoin Cash (BCH), with the closest support available at the 5,500,000-6,000,000 area.
5 Bearish Crypto Assets
1. BitShares (BTS)

BitShares (BTS) is still unable to correct the price weakness, which is inseparable from the price not moving to strengthen and cross the WMA / 85, and this is driven by insufficient positive momentum on BitShares (BTS). Resistance is at 65. This price must be passed.
2. DigiByte (DGB)

The bullish trend that lasted since April 17, 2024, harmed the price change of DigiByte (DGB), where the price has weakened by more than 10%. The bearish trend will deepen to occur. If the 160-175 area is broken, negative momentum will dominate the price change of DigiByte (DGB).
3. Chromia (CHR)

Being under negative pressure, this will be able to be corrected by Chromia (CHR) with the break of the EMA/200, which must be followed by several resistance passed, such as 5,300-6,100, and the crucial area of 7,500-8,500 will also have an impact on the bearish trend under pressure and the opportunity for bullishness is quite large.
4. Augur v2 (REPv2)

If the price cannot hold above the 6,800-11,000 level, it is expected to make the Augur v2 (REPv2) bearish trend even stronger to continue. The failure of the candle to cross the EMA/200 makes the price of Augur v2 (REPv2) weaken again, following the current trend.
5. Avalanche (AVAX)

There is an indication of a resistance area that dominates 650,000-700,000. If this area can be broken, it will make the opportunity for Avalanche (AVAX) to break EMA/200 even greater, where the bearish trend is under negative pressure because the price of Avalanche (AVAX) is increasing.
NOTES:
If EMA 5 crosses the WMA 75, 85, and EMA 200 lines, and these lines intersect from bottom to top, then the market trend tends to be upward (bullish).
Each table above shows that when the value of EMA 5 is higher than WMA 75,85 and EMA 200, the market tends to rise (bullish).
If the RSI and MACD values show the same condition, the market is showing the same trend; an overbought (overbought) or oversold (oversold) condition indicates that the market is at the point of changing trend direction.


