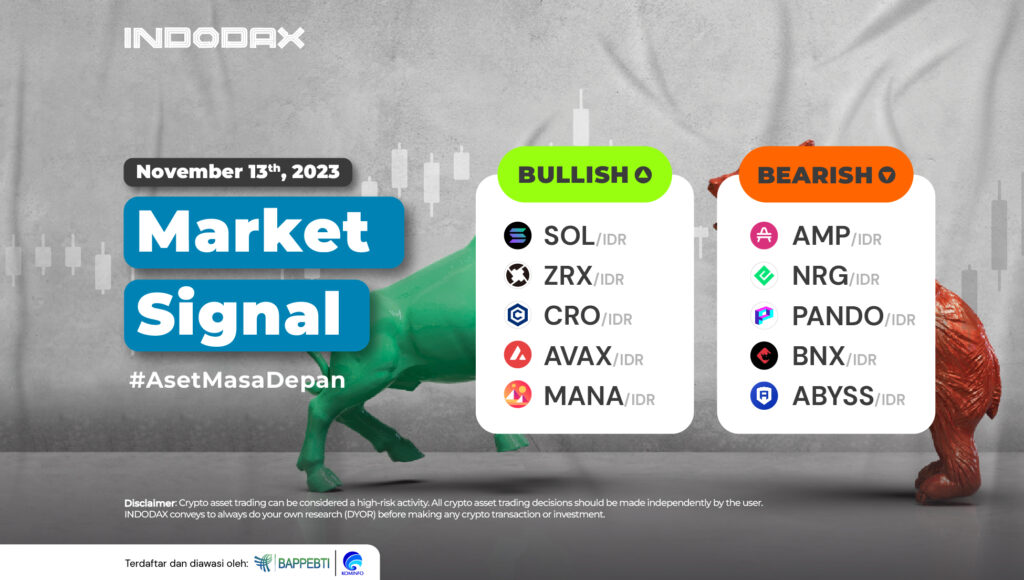
This week’s crypto asset trend is still led by Solana (SOL), which continues to strengthen, and 0x (ZRX), which follows it in the bullish ranks.
Curious about which crypto assets are experiencing bullish or bearish trends this week? Check out the complete INDODAX Market Signal update below!
5 Bullish Crypto Assets
1. Solana (SOL)

Solana (SOL) continues to move higher. This is inseparable from the trend movement, which is moving in the bullish zone. Even though the trend is in the overbought zone on the RSI indicator, the price of Solana (SOL) continues to strengthen. If the price is able to penetrate the price of 1,000,000, it will provide positive momentum for Solana (SOL) to move.
2. 0x (ZRX)

The price of 0x (ZRX) has experienced quite significant strengthening. Since being bullish on November 6, 2023, 0x (ZRX) has strengthened by 90 percent. This strengthening positively impacted the indicators used, such as the MACD, which confirmed a positive crossover. 0x (ZRX) has a resistance zone to see the trend’s strength at the 10,000-12,000 level with the assumption that if it is successfully passed, it will go to 13,500.
3. Crypto.com Chain (CRO)

After the trend touched the overbought area on the RSI indicator, the Crypto.com Chain (CRO) price weakened. The increase in the price of Crypto.com Chain (CRO) since being in a bullish trend has touched more than 90 percent. Holding the support level of 1,450-1,570 will enlarge the Crypto.com Chain (CRO) indication to confirm the direction of the MACD indicator movement.
4. Avalanche (AVAX)

The MACD indicator assumes the current Avalanche (AVAX) price movement to be in a fairly positive area. After the line intersection occurred, the Avalanche price (AVAX) increased through dominant resistance, such as 186,000-195,000. If Avalanche (AVAX) is able to form a candle above the price of 300,000, then the opportunity to test the 320,000-338,000 area is quite wide open.
5. Decentraland (MANA)

The MACD indicator shows that the current trend is in the positive zone. The Decentraland (MANA) bullish trend will be stronger and continue if the resistance area of ??7,490-8,000 can be penetrated and a candle with a complete position is formed.
5 Bearish Crypto Assets
1. Amp (AMP)

The trend movement in the 1 Day zone shows that Amp (AMP) broke through WMA/85 and the resistance zone at levels 25-30. If Amp (AMP) breaks resistance at 48-65, the bearish trend fails and the price rises to 80.
2. Energy (NRG)

The Energy Trend (NRG) is currently in a quite positive zone after MACD indicated the trend was moving to break EMA/200. If the trend is able to pass the price of 2,000, it is estimated that Energi (NRG) will head to the resistance level of 2,300-3,000.
3. Pando (PANDO)

The 1 Day chart graph indicates that Pando (PANDO) is in a bearish sideways phase with a price movement range in the range of 34-54, if the price is able to move above WMA/75, then it is possible for Pando (PANDO) to end the sideways phase positively.
4. BinaryX (BNX)

The change in the bearish trend of BinaryX (BNX) to bullish will be realized if BinaryX (BNX) can break several resistance levels such as 690,000-835,000, which is quite dominant at 1,030,000-1,400,000, where the candle will move above EMA/200.
5. Abyss (ABYSS)

The bearish trend will threaten to fail to continue if Abyss (ABYSS) succeeds in breaking from EMA/200. The MACD indicator will increasingly show that Abyss (ABYSS) is moving positively. This will encourage the Abyss trend (ABYSS) to reach the resistance level of 230-245.
NOTES:
If EMA 5 crosses the WMA 75, 85, and EMA 200 lines, and these lines intersect from bottom to top, then the market trend tends to be upward (bullish).
Each table above shows that when the value of EMA 5 is higher than WMA 75,85 and EMA 200, the market tends to rise (bullish).
If the RSI and MACD values show the same condition, the market is showing the same trend; an overbought (overbought) or oversold (oversold) condition indicates that the market is at the point of changing trend direction.
 Market

