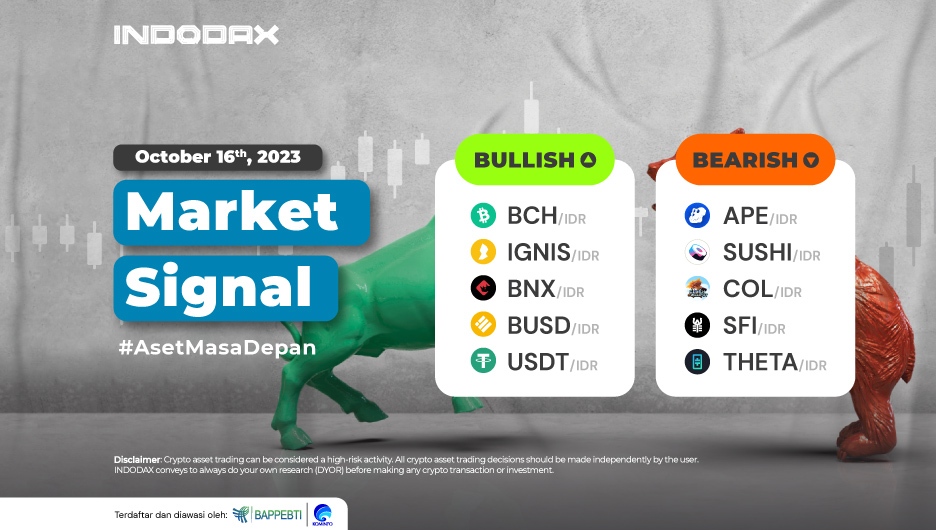
Bitcoin Cash (BCH) and USDT (USDT) continued their bullish trend and strengthened in the top position. To find out more about bullish or bearish crypto assets this week, here is the crypto market signal for the third week of October 2023 for INDODAX crypto traders!
5 Bullish Crypto Assets
1. Bitcoin Cash (BCH)

Since July 1, 2023, Bitcoin Cash (BCH) has experienced positive changes and strengthened by up to 50% in the 1 Day trend. The support area of 2,500,000-2,770,000 is crucial for the continued bullish trend. However, if a complete candle forms below this support area, the current trend will fail to continue.
2. IGNIS (IGNIS)

IGNIS (IGNIS) confirmed a bullish trend by successfully forming a candle above the dominant resistance area at prices 52-62. Holding above WMA/75 will strengthen positive momentum, driven by the MACD indicator with resistance available at 88-97.
3. BinaryX (BNX)

On October 13, 2023, BinaryX (BNX) entered an uptrend phase. However, if the price weakens and breaks below the support area of 320,000-360,000, and EMA/200 fails to hold, there is a significant potential for the trend to reverse direction and not be able to continue the trend movement.
4. Binance USD (BUSD)

5. USDT (USDT)

The price weakening did not break through the WMA/85 line, so USDT (USDT) experienced strengthening and continued the bullish trend. If the price has not been able to pass the level of 15,860-16,000, then the bullish trend has not been able to form a new direction for the movement of USDT (USDT).
5 Aset Kripto Bearish
1. ApeCoin (APE)

Although the price of ApeCoin (APE) was able to strengthen again, it is still in the downtrend zone. The trend did not succeed in passing the EMA/200, so the price experienced another correction. In order to realize price changes, resistance at the level of 27,000-37,000 must be passed. If ApeCoin (APE) can cross this resistance level, it has the potential to reach a price of 44,000-60,000.
2. SushiSwap (SUSHI)

Since December 3, 2021, the price of SushiSwap (SUSHI) has significantly weakened while being in the bearish zone. SushiSwap (SUSHI) has experienced an 80% decrease in value. In order to repair the damage caused by the bearish trend, SushiSwap (SUSHI) needs to break out of the price range of 19,000-25,000.
3. Clash of Lilliput (COL)

The bearish trend caused negative momentum for the Clash of Lilliput (COL) price, which hit its lowest level on September 21, 2023, while trading on INDODAX. If it fails to pass the 9,000-12,500 area, it is estimated that the Clash of Lilliput (COL) will still be unable to correct the weakening trend. Keeping a close eye on the price and support area is crucial to ensure successful trend reversal.
4. saffron.finance (SFI)

The MACD indicator shows that the current saffron.finance (SFI) trend is still in a bearish sideways phase with a price movement range of 350,000-500,000. If either level can be broken, it will confirm a break of the MACD.
5. THETA

In the 1 Day timeframe used, THETA (THETA) has touched its lowest price. The current trend is in the bearish sideways zone with the price movement range around 9,000-10,600. Price will be able to cross the WMA/75 line if it passes this resistance.
NOTES:
If EMA 5 crosses the WMA 75, 85, and EMA 200 lines, and these lines intersect from bottom to top, then the market trend tends to be upward (bullish).
Each table above shows that when the value of EMA 5 is higher than WMA 75,85 and EMA 200, then the market tends to rise (bullish).
If the RSI and MACD values show the same condition, it means the market is showing the same trend, an overbought (overbought) or oversold (oversold) condition is an indicator that the market is at the point of changing trend direction.


