
Before knowing what a candlestick is, understand candlestick patterns to be profitable when you start trading.
Therefore, candlesticks are very important because it is the beginning of understanding technical analysis to determine buying and selling.
By knowing what a candlestick is, you can understand prices’ up and down movement.
While these price movements are sometimes very random, they form a pattern at other times.
Traders then use this pattern to analyze something before trading. Common patterns of candlesticks are bullish and bearish.
Why are Candlestick Patterns Important in Trading?
Candlesticks are the most popular chart type and are often used to determine position entry or break out in the technical analysis. You also need to know where the support and resistance areas are.
Then, why are candlestick patterns important in trading? Because with candlesticks, we can easily read market conditions that have the potential to be bullish (up) or bearish (down).
It is essential that we can find out where the market movement will go with candlestick patterns.
Candlestick Basic Shapes
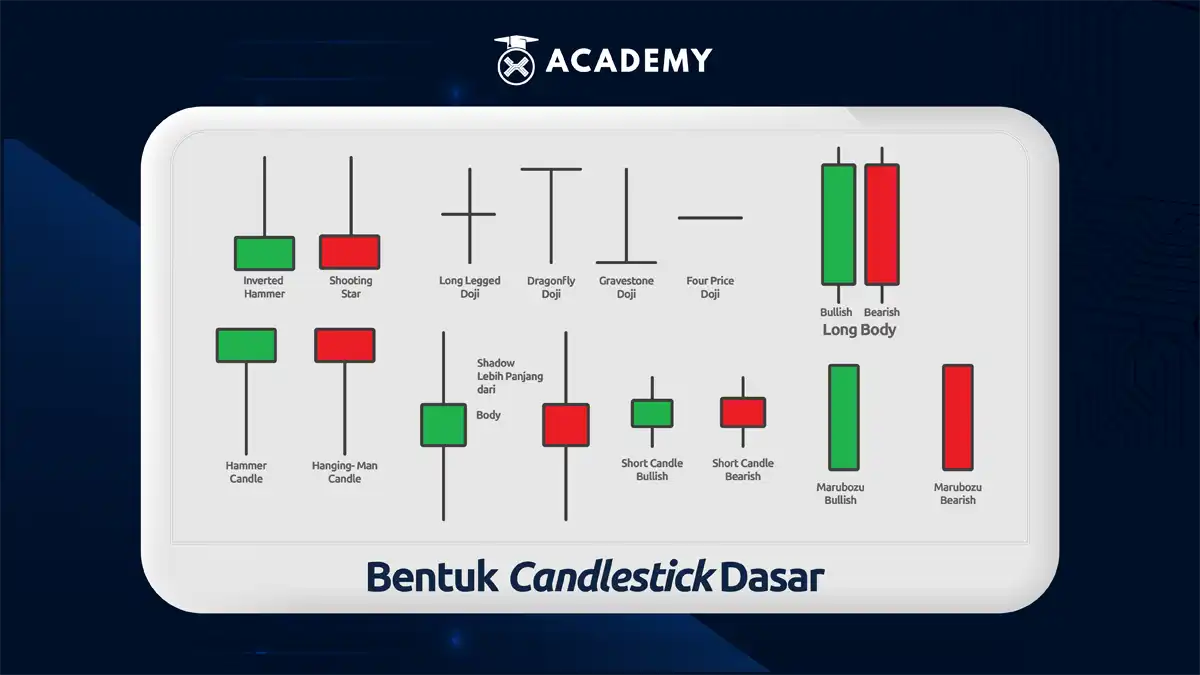
In forming a candlestick, data will be taken for opening, high, low, and closing.
An up candle has an open position below and closes above the body, while a bearish candle has an open position above and closes below the body.
Three Black Crows is a bullish/bearish price trend change candlestick pattern.
This pattern consists of three bearish candlesticks colored Green to go up or red to go down 3 in a row, where the closing price of each candle is always lower.
It is compared to the previous candle, indicating a change in the candlestick pattern.
As is known, there are many candle patterns. Several candle patterns have the potential to be more profitable than others, namely:
1. Marubozu
This Marubozu candle pattern occurs with a whole body without a tail. This shape indicates a very confident market. Usually, the trend that occurs will continue.
There are two types of Marubozu: the Green Marubozu (bullish) and the Red Marubozu (bearish).
2. Dojis
This Doji candle is a reversal pattern where confirmation often occurs, which is a type of candlestick where the opening and closing prices are almost the same, so only a thin line is visible in the middle of the shadow.
3. Hammers
Candle Hammer is a form of candle that is like a hammer. His trademark is only one shadow.
Usually an indication of a reversal. The opposite of the Inverted Hammer, this pattern is also usually a potential reversal.
4. Engulfing
The Engulfing candle is a potential solid reversal. The feature of this pattern is indicated by a short candle followed by a longer candle so that the height covers the previous candle that was formed.
Essential Elements You Need to Know in Reading Candlesticks

The essential elements that you must understand from candlestick patterns start from the size of the body, the length of the body or shadow, and the position of the body on the candlestick.
The following are readings and examples of elements you should know before starting market analysis on candlestick patterns.
Element 1: Candlestick Body Size
The size of the candlestick body is a good starting point to know better where the candle starts moving and the length of the body to show strength. Elongated body size means showing the strengthening of momentum.
- When the body is more petite, the momentum is also not strong.
- The body length shows how far the price has moved throughout the candle or timeframe.
Element 2: Candlestick Wick Length (Wick)
The length of the candlestick wick informs the volatility of price movements.
- The long wick indicates that the price moved quickly during the relevant candlestick but experienced resistance due to resistance.
- If the wick is getting longer, it means that volatility is increasing. It all happens at the end of a market trend, at a price reversal, or when prices are nearing Support and Resistance
Element 3: Body and Shadow Length Ratio
From here, we already know the big picture in reading candlesticks.
- We often find long-body candlesticks with smaller wicks during an upward momentum trend.
- When the market is experiencing uncertainty, volatility increases so that the candlestick’s body is small, but the wick is longer.
Element 4: Candlestick Body Position
This element is a development of the previous element.
- A long wick candlestick with the body position at one end is the resistance of the body position.
- Candlesticks with a body positioned in the middle of the lower and upper tails indicate uncertainty in the market.
The candlestick will be more accurate if the movement is confirmed to be the same or close to the direction of its move from the lowest to the highest period.
If a trader uses a short timeframe to make a profit, use a more petite time frame like 1 Hour and 15 Minutes.
Example of Candlestick Pattern Analysis
1. Engulfing Candlestick Pattern
This engulfing pattern is a candlestick pattern that has the potential for a reversal.
To reverse up is called bullish engulfing, and to reverse down is called bearish ruining.
The visual pattern is called bullish engulfing if the candlestick with a long body shows an increase.
2. Doji Candlestick Pattern
The Doji pattern is formed because the opening and closing prices are the same, including a long candlestick tail.
This Doji pattern shows the power of buyers and sellers in balance over a certain period.
This pattern also shows that the market can still not determine where the next price movement will go.
3. Hammer and Hanging Man Candlestick Patterns
These two patterns are candlesticks with a small body and a long tail twice the body’s length. These two patterns have the potential for a reversal to occur.
The Hammer pattern has the potential to reverse up, while the Hanging Man pattern has the potential to reverse down.
4. The Harami Candlestick Pattern
The candlestick pattern is called Harami, when a candlestick with a small body and a short tail appears after the candlestick with a long body.
The appearance of the Harami indicates the strength of the trend is starting to weaken and can eventually lead to a reversal.
5. The Marubozu Candlestick Pattern
The Marubozu candlestick pattern shows the direction of price movement. Marubozu is a candlestick with a long body that indicates a price reversal.
So, to see an example of candlestick pattern analysis, it’s a good idea to know the highest and lowest prices on the Indodax market price page as a reference before deciding to start a transaction.
 Market

