Some tools in stock and crypto investments are popular in technical analysis, including candlestick analysis.
Related to this, candlestick analysis is mandatory for traders to understand to achieve maximum profit.
The candlestick analysis consists of various patterns, including the Morning Star Candle and the Evening Star Candle.
Both types of candlestick patterns are significant reversal patterns.
Therefore, the movement of these two patterns is important to understand because they can signal a change in the trend of price movements in the market.
To better understand the meaning, difference, how to trade, and the strategy of using the morning star candle, see the following review.
Morning Star Candles
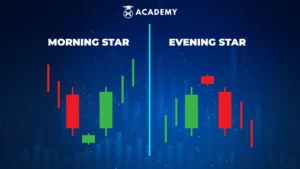
A morning star candle is a candlestick pattern that describes a trend reversal from bearish to bullish.
To identify this pattern, traders can analyze three candle formations on a candlestick chart.
The shape of this pattern is like a bullish reversal candle pattern. However, in this pattern, several things distinguish it.
It is known the first candle shows that the price is declining (bearish), while the second candle can be bearish, bullish, or doji—when the opening and closing prices are the same.
Meanwhile, the third candle must show the potential for the price to reverse in the form of a bullish candle.
Besides that, the length of the body of the third candlestick must exceed half the length of the body of the first candlestick.
Please note several characteristics make up the Morning Star Candle pattern, including:
- This pattern always starts with a downtrend (a downward trend in price movements).
- The price of the first candlestick must be below the open price in the form of a bearish candlestick
- The second candlestick can be bearish, bullish or doji
- Furthermore, there is a gap between the close price of the first and second candlesticks
- The price of the third candlestick must be above the close price in the form of a bullish candlestick
- There is a gap between the second and third candles
It is important to understand that the Morning Star Candle is a visual pattern, so there is no need for special calculations in this case.
The morning star candle is a pattern of three candles, with the lowest point in the second candle.
However, the lowest point is only visible after the closing of the third candle.
Furthermore, other technical indicators can help predict when the morning star candle is formed.
For example, regarding whether the price movement is approaching the support zone or whether the Relative Strength Indicator (RSI) shows that the asset has been traded at a price lower than the fair price (oversold).
Evening Star Candles
The Evening Star Candle pattern is a bearish reversal pattern; the opposite of the Morning Star Candle pattern is bullish.
However, this evening star candle pattern, like the morning star, is also known to have three candle bodies.
To identify this pattern, traders can look at the first candle, which is a bullish candle body.
Meanwhile, as in the morning star candle pattern, the second candle pattern in the evening star candle has a small size that can be in the form of a bullish, bearish, or doji candle.
On the other hand, the third candle is bearish, describing a price decline.
At least there are several characteristics that make up the evening star candle pattern, which are as follows:
- Formed when the price uptrend increases
- The first candlestick is in a bullish position
- There is a gap between the first candlestick and the second candlestick
- As in the morning star candle pattern, the second candlestick is in the form of a bullish or bearish candle
- Meanwhile, the third candlestick should be bearish
This pattern will be created when the asset price is in an uptrend (bullish) position.
On the other hand, the body of the first candlestick will be bullish, while the second candlestick will create either bullish or bearish, depending on market conditions.
Then, in this pattern, a gap will also form between the first candle and the second candle, while the body of the third candle will be in the form of a bearish candlestick.

Difference between Morning Star Candle and Evening Star Candle
Even though they are both part of candlestick analysis, the Morning Star Candle and the Evening Star Candle have differences.
The common thing that is different between the two is that if the Morning Star Candle pattern is bullish, then the Evening Star Candle pattern is bearish.
However, of course, there are also several other differences between these two types of candlesticks.
Here are some of the differences you need to know, including:
1. Differences in the appearance of the charts and the order of the candlesticks that make up the pattern
The difference can be seen in the chart display and the sequence of candlesticks that make up the pattern.
Besides, the morning star pattern can be the basis for entering long positions in starting trading time.
Meanwhile, on the contrary, the evening star can be the basis for entering short positions in trading.
2. Interpretation and meaning of the pattern in the context of candlestick analysis
It should be noted that there are different meanings between the morning star pattern and the evening star pattern.
The morning star will be a strong signal that the price will experience a certain increase.
Unlike the morning star, the evening star pattern will signal that the price will turn downward.
3. The influence of the pattern on the direction of the trend
Note that the difference between the two candle patterns is identical to the first candle.
The first candle created in the morning star candle pattern will begin with a bearish candle indicating that the asset is in a downtrend phase.
Meanwhile, on the evening star candle, the first candle will usually be created with a green candle or a sign that the asset is in an uptrend phase.
Traders usually use the morning star candle to buy entries, while traders will shun the evening star candle and often even becomes a signal to sell.
How to Trade with the Evening Star Candle
The evening star candle is often seen as a pattern indicating that a downward trend has started.
Even so, traders often need help distinguishing this pattern’s movement amid the market’s rapid price changes.
However, for trading with the evening star candle pattern, traders can use price oscillators and trend lines.
This confirms whether the evening star candle pattern has been formed perfectly.
Usually, this pattern will be formed in three days, with the following explanation, namely:
- First day
On the formation of the pattern on the first day, a large green candle body will appear, which is a sign of a sustainable price increase.
- The second day
As for the formation on the second day, the candle’s body will be present in a smaller size, representing a more modest price increase.
- The third day
On the other hand, a big red candle body will appear on the third day. In this case, the open price is below the price of the previous candle and then closes near the middle of the first day.
In this case, it is important for traders to ensure that on the third day, the evening star candle pattern has been formed perfectly.
This is indicated by the volume of the third candle, which is half smaller than the first candle.
This is a strong indication that prices will decline.
Then, traders can only place a sell entry position by placing a stop loss at the top of the candle pattern.
Benefits of Morning Star Candle and Evening Star Candle

The Morning Star Candle and Evening Star Candle patterns benefit traders.
By understanding these two types of patterns, traders will know the exact reversal trend later.
Furthermore, traders can make the right trading decisions to achieve maximum profit.
The following are some of the benefits of the Morning Star Candle and Evening Star Candle patterns, namely:
1. Trend Reversal Signals
Understanding the Morning Star Candle and Evening Star Candle patterns will help traders anticipate potential market price reversal trends by giving signals.
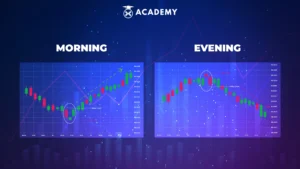
If the morning star candle is formed during a downtrend and then sends an uptrend reversal signal, then the evening star candle is present during an uptrend and then gives a signal that there will be a downtrend.
2. Standard Entry Trading
With an understanding of these two patterns, traders can later find benchmarks for trading entries.
In this case, traders can place entry-buy positions when the morning star candle pattern is perfectly formed.
On the other hand, traders can place short entry positions when the evening star candle pattern has been formed perfectly.
3. Accurate
Another benefit is that traders only need to conduct technical analysis related to the conditions for forming a morning star candle or evening star candle pattern to keep the results of the analysis of these two patterns accurate.
This can happen because these two patterns are just visual formations without the need for special formulation calculations.
Trading Strategy Using Morning Star Candle and Evening Star Candle
It should also be understood that the morning star candle pattern can be used for trading decision-making.
This is because the morning star candle pattern is usually used as a trading strategy that allows traders to predict potential market reversals.
Apart from that, please note that this pattern can be applied to several different trading strategies.
Meanwhile, if you want to trade with the morning star candle pattern, you must ensure that the selected trading instrument is in a downtrend position.
Then, before making an entry, it must also be ensured that the morning star pattern has been formed perfectly.
Then, to confirm the buy entry, the trader can draw the trendline from the first open candlestick.
Then, please wait for the next candlestick to make a breakout at the first candlestick.
As for the morning star candle, the center of the pattern can be seen from the existence of a doji candle, that is when a doji candle is created under a bearish candle so that the next candle will be bullish.
Furthermore, the confirmation point can be found in the third candle, with the body length of the candle having to be longer than the first candle.
This shows a strong signal that the price trend will reverse.
Then, traders can enter buy positions when the next candlestick closes. The trick is to place a stop loss at the bottom of the glow morning star candle.
Morning Star Candle can be used as a sign to start a trend reversal from bearish to bullish.
However, it becomes even more important in practice when other technical indicators support using this one candle.
Another important factor to note is the volume that contributes to pattern formation.
For example, a trader wants to see volume increase over three sessions, forming a pattern in which the third day is the most volume.
It is known high volume on the third day is often seen as a confirmation of the next uptrend pattern outside of other indicators.
Therefore, a trader would take a bullish position on the asset when the morning star forms in the third session and then ride the uptrend until another indication of a reversal appears.
Conclusion
A summary of the Morning Star Candle and Evening Star Candle patterns and the importance of understanding these patterns in candlestick analysis.
In conclusion, the Morning Star candle is a candlestick pattern that describes a trend reversal from bearish to bullish.
To identify this pattern, traders can analyze three candle formations on a candlestick chart.
The Evening Star Candle pattern is a bearish reversal pattern, and the opposite of the Morning Star Candle pattern is a bullish one.
However, this evening star candle pattern also consists of three candle bodies, as in the morning star candle pattern.
To identify this pattern, traders can look at the first candle, which is a bullish body candle.
These two types of patterns are important to understand in candlestick analysis by traders.
The reason is, by understanding these two patterns, later traders will know the exact reversal trend.
Furthermore, traders can make the right trading decisions to achieve maximum profit.
Thus a complete discussion of the morning star candle and the evening star, starting from the understanding to the strategy for using it, is important to know.
So, next, you can also read various other interesting articles, such as doji candles and hammer candles, at INDODAX Academy.


