
As a trader or even you who want to start trading, do you know what a Hammer candlestick is? Let’s discuss hammer candlesticks in the following review!
What is a Hammer Candlestick?
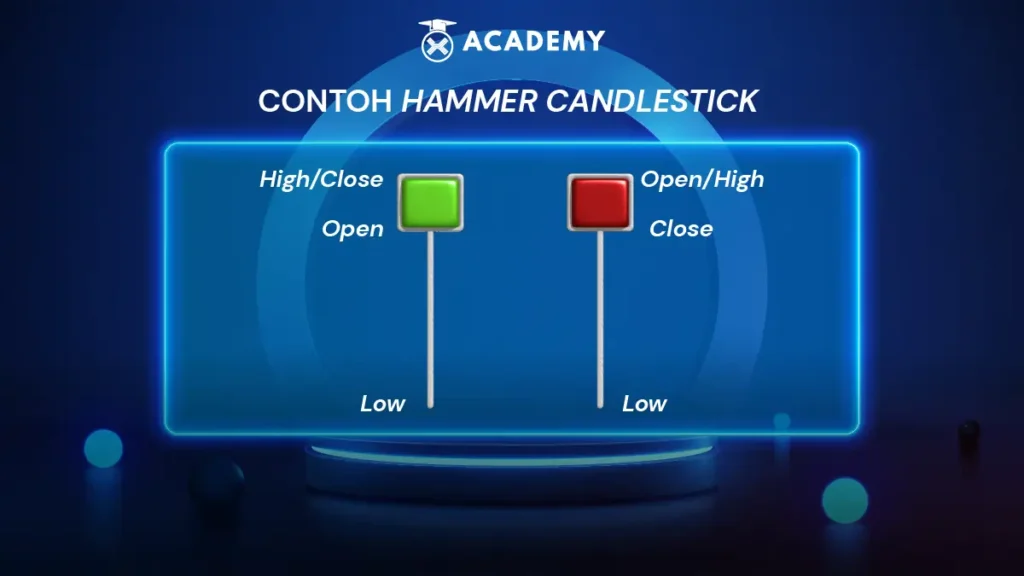
The hammer candlestick pattern is a chart pattern on a security that shows a lower price than its open.
This pattern is called a hammer candle because it looks like a hammer, with the shadow of the Candlestick being twice the size of the actual body.
This candle is a bullish reversal pattern that usually appears at the end of a downtrend or downtrend session.
Therefore, this pattern is also commonly known as the bullish hammer candlestick. The body of this Candlestick represents the difference between the open and closed prices.
The shadows show the highest and lowest prices for that period. This pattern will signal a potential trend reversal.
In this case, the price will decrease after the opening and return near the open price.
Hammer candlestick example
An example of the hammer candlestick pattern can be seen in the image above. The chart shows a price decline (bearish) followed by a hammer candlestick at its lowest point.
The hammer candlestick has a long lower shadow (wick), two or three times longer than the original body.
Meanwhile, confirmation of the price reversal from bearish to bullish can be seen in the next candle, which has a higher gap.
Before discussing the differences between a hammer and a hanging man, as a trader, you need to know candlestick signals and candlestick formulas first.
The difference between the Hammer and the Hanging Man
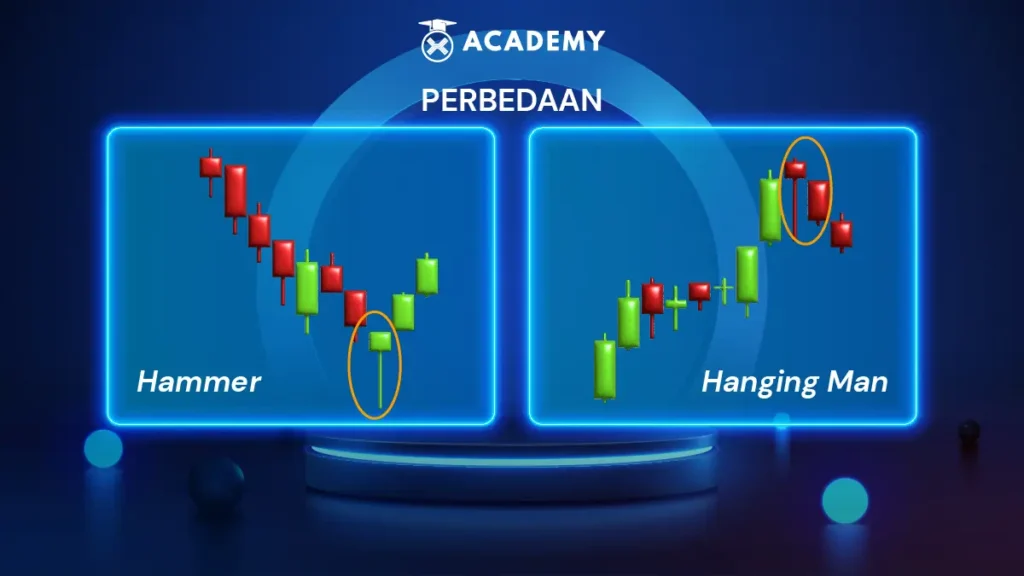
The Hammer and hanging man patterns are almost similar visually, but each pattern has several differences, some of which are as follows:
1. The appearance of the Candlestick
First, the bullish hammer candlestick pattern will be found in a downtrend, which, if confirmed, will turn into an uptrend.
However, this hammer-shaped candle can also be found in an uptrend called a bearish hammer candlestick.
This pattern is known as the Hanging Man pattern. Quoting the Babypips page, the hanging man is a bearish reversal pattern that can also mark the top resistance level.
2. Signals Provided
In this case, the Hammer is a marker of a bullish trend, while the Hanging Man is a bearish trend marker.
3. Candlestick Forms
The wick or lower shadow is two or three times the length of the Candlestick. Like the Hammer pattern, this one can have little or no upper shadow.
On the other hand, the candle’s body is at the upper end of the trading range. The hammer candle is usually white (green), while the hanging man is black (red).
How to Use the Hammer Candlestick in Trading
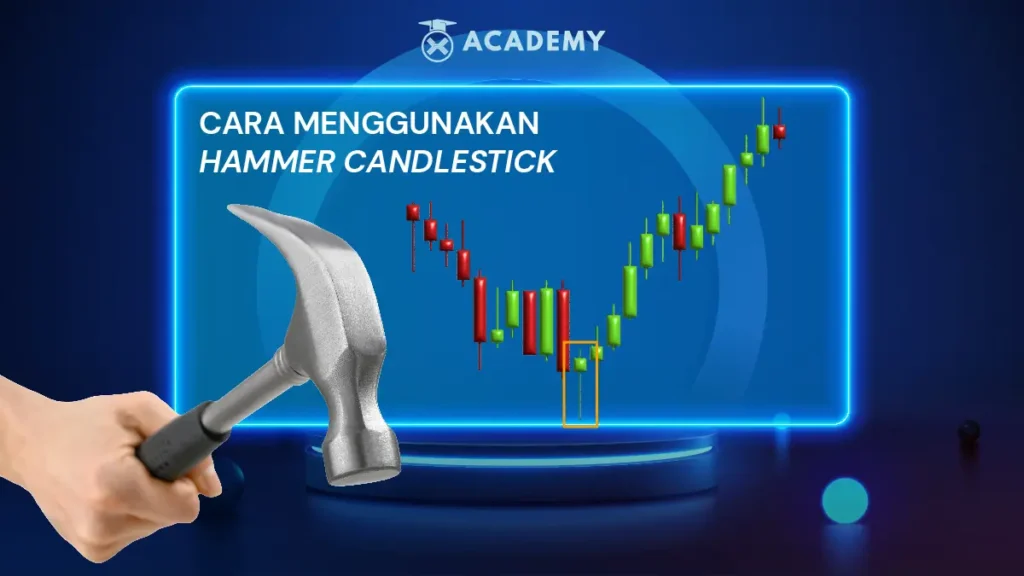
1. Finding a Bearish to Bullish Trend Reversal
Usually, the hammer candlestick appears after a price decline chart. This one candlestick pattern occurs when many sellers enter the market during a price decline.
Meanwhile, when the market closes, the arrival of buyers will absorb selling pressure and push the market price closer to the opening price.
Therefore, this pattern marks a reversal from bearish to bullish.
That is, after this pattern occurs, the trend will slowly increase. This pattern will be confirmed when the price starts moving up following the Hammer.
2. Buying/Selling Assets
This pattern forms the letter “T” and does not indicate an upward price reversal until confirmed.
Confirmation occurs when the next candle closes above the closing price of the hammer candle.
The confirmation indicates a strong buying impulse. During the confirmation period, investors will generally look for opportunities to enter long positions/exit short positions.
Conclusion
A hammer candlestick is a chart pattern in a security asset that shows a lower price than its open.
It is called a hammer candle because this pattern is in the shape of a hammer, with the shadow of the Candlestick being twice the size of the actual body.
On the other hand, the Hammer and hanging man patterns can be distinguished by several characteristics, including the appearance of the Candlestick, the signal given, and the shape of the Candlestick.
Meanwhile, to use the hammer candlestick pattern in trading, there are several ways you can do it, namely by finding a bearish to bullish reversal trend and buying or selling assets.
Well, now you have learned about the hammer candle pattern. Now, it’s time for you to start trading Crypto on Indodax. Good luck!
 Market

