Have you ever seen a similar chart repeat itself after a previous crash? For many crypto traders, this is nothing new.
When the crypto market crashes and then slowly recovers, the resulting chart often looks like a carbon copy of the past. This isn’t a coincidence, but rather a reflection of recurring patterns in the crypto world.
This phenomenon shows that price movements often follow certain recognizable patterns. This is not only due to market emotions, but also due to the structure of mass behavior that creates similar patterns over time.
This is where the concept of fractals becomes important. Fractals aren’t just a mathematical term—in the world of trading, they serve as a tool for detecting pattern similarities, even when time scales and prices change.
Understanding fractals means understanding how history can repeat itself, in slightly different ways, yet still feel familiar. To find out, let’s read the full review below.
What Are Fractal Patterns in the Crypto World?

Have you ever noticed that price movement patterns in crypto charts often appear to repeat previous patterns, albeit on different time scales?
This is what’s known as a fractal pattern. In the context of financial markets, a fractal refers to a price pattern that appears to repeat itself, both over long and short time frames.
This means that what appears on a weekly chart may resemble the same shape on a daily, or even hourly, chart.
The term fractal itself comes from mathematics, introduced by Benoit Mandelbrot in the 1970s.
He observed that many natural phenomena, such as the shape of leaves or coastlines, have similar structures on both large and small scales, a property called self-similarity.
When applied to financial markets like crypto, fractals help reveal that behind seemingly random price movements, there are recurring patterns caused by mass psychology and the emotional cycles of market participants.
In trading practice, fractals are not just a technical term; they are a real tool for detecting potential price reversal points.
Traders often utilize fractal patterns to determine when to enter or exit the market, set stop-losses, and identify support and resistance areas.
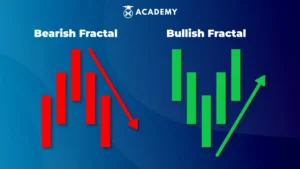
One characteristic of fractal patterns is the formation of a prominent midpoint—a peak or valley—flanked by two lower or higher points on either side. This pattern often signals a potential change in price direction.
However, it’s also important to understand that fractal patterns are not absolute forecasting tools. As Mandelbrot explained, fractals are not used to predict price fluctuations on a particular day.
Instead, fractals help estimate the likely direction of market movement based on recurring historical structures.
In other words, fractals provide a framework for understanding “order in chaos,” not absolute certainty.
Therefore, in the highly volatile crypto world, understanding fractal patterns can be one way to strengthen technical analysis.
While they cannot stand alone as a predictive tool, fractals become even more useful when combined with other indicators, helping traders spot opportunities in seemingly complex charts that are actually full of hidden patterns.
Fractal Pattern Characteristics: 5 Unique Candlesticks
In technical analysis, fractal patterns are used to identify potential price reversals based on recurring market movement patterns.
This pattern, at its most basic, consists of five candlesticks forming a distinctive structure and is often an early indication that market sentiment may soon change direction.
1. Upper Fractal (Bearish)
In an upper fractal, or bearish fractal, the middle candlestick is the highest high, flanked by two candlesticks on the left and right, each forming lower peaks.
This formation indicates that bullish forces are weakening and the price has the potential to reverse downwards.
2. Lower Fractal (Bullish)
Conversely, in a lower fractal, or bullish fractal, the middle candlestick is the lowest low, with the two candlesticks on the left and right having higher valleys.
This pattern indicates a possible shift in sentiment from selling to buying, which could open the opportunity for a trend reversal to the upside.
It’s important to note that fractal patterns don’t form immediately upon the appearance of the middle candlestick. A fractal is only confirmed after the two candlesticks on the right have completed, so there’s always a slight delay in the signal.
However, once the pattern is complete, it can be a valuable clue in mapping potential price turning points.
While there are many variations and other complex patterns, this five-candlestick pattern serves as the primary basis for recognizing fractal structures in crypto charts.
Ideal examples of each pattern can be seen more clearly through charts that visually show the arrangement of peaks and valleys, which can be added to help reinforce understanding.
You might also be interested in: Want to Increase Profits? Understand Complete Chart Patterns!
How to Use Fractal Patterns in Chart Analysis
Fractal patterns can be quite reliable tools for reading market direction, particularly in detecting potential trend reversals.
When these patterns appear, whether fractal tops or fractal bottoms, traders can use them as early signals that price momentum may be about to change.
Besides serving as early warnings, fractals are also useful for determining market entry and exit points. For example, when a lower fractal forms in a support area, it can be a reference for opening a buy position.
Conversely, an upper fractal in a resistance area can be a signal to consider selling or securing profits.
However, because fractal signals have a slight delay, requiring confirmation from two subsequent candlesticks, they should not be used alone.
To increase accuracy, fractal patterns should be combined with other technical indicators such as the RSI, MACD, or Ichimoku to clarify trend direction and momentum.
With this integrated approach, fractal patterns can be part of a more comprehensive technical analysis strategy, helping traders make more informed decisions amidst crypto market volatility.
Examples of Fractal Patterns in Crypto: Bitcoin & Altcoins

In the crypto world, fractal patterns are not just abstract concepts; they can be seen directly in the price movements of major assets. One of the most striking examples is Bitcoin.
If you examine the BTC chart from 2017, 2020, and up to the present, you’ll notice a familiar pattern.
Whenever a major rally is followed by a sharp correction, the waveform, both in terms of structure and movement dynamics, often resembles the previous pattern.
For example, Bitcoin’s price surge to a peak of $20,000 in late 2017 was followed by a sharp decline in 2018, followed by an accumulation phase.
This pattern is remarkably similar to the movement to the peak in 2021 and the subsequent consolidation phase.
Although the timeframes differ and the triggers can vary, this fractal pattern reflects the recurring psychological cycles of the market, ranging from euphoria to fear to renewed hope.
This phenomenon is not unique to Bitcoin; it is also seen in major altcoins like Ethereum (ETH), Solana (SOL), and Cardano (ADA).
For example, ETH has shown a price pattern that resembles BTC’s previous movement structure, seemingly following the “trails” of the dominant asset.
Solana has also shown up-and-down waves reminiscent of BTC’s fractal patterns on a smaller scale. ADA has even formed a consolidation pattern similar to the sideways phase that occurred in Bitcoin several years earlier.
However, it’s important to emphasize that pattern similarities don’t necessarily mean the end result will always be the same. Fractals, in the market context, mean repeating patterns in structure, not exact copies.
Price movements are still influenced by many variables, from market news and global sentiment to regulation.
Therefore, while fractal patterns can provide valuable insights, traders should still combine them with other analysis and not rely solely on them.
Another interesting article for you: What’s the Difference Between Fundamental and Technical Analysis? Here’s the Explanation
Advantages & Limitations of Fractal Patterns
Fractal patterns are a technical analysis tool increasingly used by crypto traders. Besides their ease of use, these patterns have also been boosted by advances in technology and the digital trading community.
However, despite their advantages, there are also limitations that must be understood to ensure their use remains effective and realistic. Here’s a review of their advantages and disadvantages:
Advantages
1.Can appear on various time frames
Fractal patterns can be recognized on almost any time scale, from 1-minute to weekly charts.
This makes them a flexible tool that can be used by various types of traders, both those focused on intraday trading and those analyzing long-term trends.
2.Easy to read if familiar with candlesticks
The structure of a fractal pattern consists of only five candlesticks, with a peak or valley in the middle flanked by two lower (for upper fractals) or higher (for lower fractals) candlesticks.
Traders familiar with reading candlestick patterns will easily recognize this arrangement without the aid of complicated tools.
Limitations
1.Often appear too late for quick entry
One of the main weaknesses of fractals is that their signals are only confirmed after two additional candlesticks form on the right side.
As a result, this pattern has a natural lag, making it less suitable for strategies that rely on quick reactions, such as scalping or breakout entries.
2.Must be confirmed with additional indicators
Because fractal patterns only indicate possible reversal points, their signals are often too general when standing alone.
To increase accuracy, traders are advised to combine fractals with other technical indicators such as the RSI, MACD, or moving averages for more confident entry and exit decisions.
Conclusion: Fractals Are Patterns, Not Predictions
So, that was an interesting discussion about Crypto Fractal Patterns, which you can read in full at the INDODAX Academy.
In conclusion, fractals are not a tool for predicting the future, but rather a way to recognize recurring patterns amid seemingly random market movements.
Fractals help traders read price structures more clearly, especially in identifying potential trend reversals.
However, patterns are still patterns because they don’t guarantee certain results. Every trading decision still needs to be based on strong logic, thorough analysis, and disciplined risk management.
By understanding their limitations and using them as part of a broader strategy, fractals can be a very useful tool in navigating the dynamic crypto market.
By the way, besides broadening your investment horizons, you can also stay updated with the latest crypto news and monitor digital asset price movements directly on the INDODAX Market. Don’t forget to activate notifications to stay up-to-date with the latest information about digital assets and blockchain technology, only on INDODAX Academy.
You can also follow our latest news through Google News for faster and more reliable access to information. For an easy and secure trading experience, download INDODAX’s best crypto app on the App Store or Google Play Store.
Maximize your crypto assets with the INDODAX Earn, feature, a practical way to earn passive income from your holdings.
Also follow our social media here: Instagram, X, Youtube & Telegram
FAQ
1.Are fractal patterns technical indicators?
Yes, fractal patterns are technical indicators. They help identify price reversal points based on repeating candlestick structures on the chart.
2.Can they be used on daily or 4-hour charts?
Yes. Fractal patterns are flexible and can appear on various time frames, from 1 minute to weekly—including 4-hour and daily charts.
3.Are all repeating patterns fractals?
Not always. Fractal patterns have a distinctive structure with 5 candlesticks and a prominent center point. Not all repeating patterns are fractals.
4.How accurate are fractal patterns for making trading decisions?
They are quite helpful, but it’s best to combine them with other indicators like the RSI or MACD for greater accuracy.
5.Why are fractal signals often delayed?
Because the pattern is only confirmed after two additional candlesticks form on the right side, so there’s a natural lag in the signal.
Author: Boy


 Polkadot 8.91%
 BNB 0.54%
 Solana 4.81%
 Ethereum 2.37%
 Cardano 1.35%
 Polygon Ecosystem Token 2.11%
 Tron 2.85%
 Market


