In the crypto asset investment chart, several types of patterns need to be studied by investors or traders.
One such pattern is the Rising Wedge. Generally, a wedge is an asset price pattern marked by the convergence of trend lines on the price chart.
Wedge is formed from the price of crypto assets in a certain period. Technical analysts consider Wedge-shaped trendlines a valuable indicator of potential price reversals.
The lines indicate that the high and low are at different levels, giving the appearance of a wedge as the lines approach convergence.
The wedge pattern indicates a price reversal when conditions are bullish or bearish.
In both cases, this pattern has three common characteristics:
- Converging trend lines
- The pattern decreases in volume as the price continues through the pattern
- Lastly, a breakout of one of the trendlines
The Wedge has two forms: the rising Wedge and falling wedge patterns. Both patterns work as continuation or reversal patterns.
The difference is that the Falling Wedge pattern forms a bullish chart pattern that occurs in an uptrend and a downward-sloping line.
Meanwhile, the Rising Wedge pattern forms a bearish chart pattern found in a downward trend and an upward-sloping line.
This time we will discuss the Rising wedge pattern. A rising wedge is a pattern that is often used to make a profit.
If you want to know more about the Rising Wedge pattern, what are the advantages and strategies for using it? Let’s see more here!
What is the Rising Wedge Pattern?

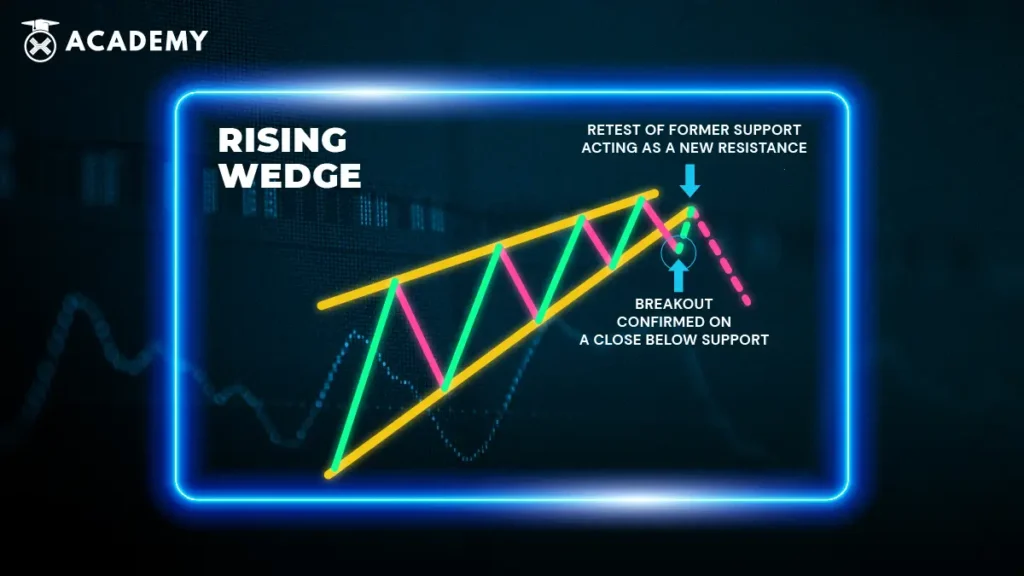
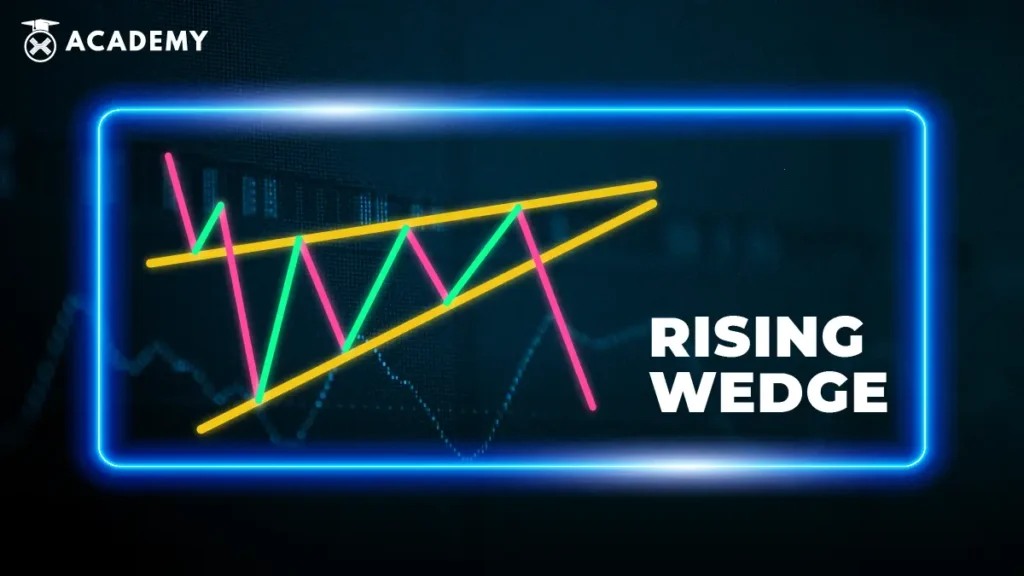
The rising Wedge pattern forms when the price consolidates between an upward-sloping support line and a resistance line.
The slope of the formed support line will usually look steeper than the resistance line.
This pattern indicates that a faster, higher support point is forming above the highest resistance point.
This pattern also indicates that a big jump is coming, so we can predict a break to the top or bottom.
If the Rising Wedge pattern is formed after breaking the uptrend line, it signifies a bearish reversal pattern.
Conversely, if it is formed when it breaks the downtrend line, it also indicates the continuation of the downtrend.
Rising Wedge Criteria
A rising Wedge is often referred to as a reversal pattern, meaning that the pattern is included in the advanced category.
As a category of continuation patterns, the Rising Wedge remains sloping to the upside but is going against the prevailing downtrend.
The criteria for the Rising Wedge pattern include the following:
- The Rising Wedge pattern is usually marked with converging trend lines during 10 to 50 transaction periods.
- The Rising Wedge pattern is considered a wedge up or down depending on the direction of the trend.
- This pattern has a good track record of predicting price reversals.
- When the breakout has the opposite direction to this type of Wedge, the slice becomes steeper, making the signal emitted more accurate.
Example of a rising wedge
The rising wedge pattern also serves as a technical indicator that shows the reversal patterns often seen in the bearish zone.
This pattern will appear on the chart when the price movement is rising with pivot lows and highs that converge and form a point called the apex.
The Rising Wedge can be a difficult pattern to identify accurately. Loss of momentum above each successive high would give a bearish pattern.
However, a series of higher highs and higher lows will create an inherently bullish trend.
A support break indicates superior bidding power and a lower probability of a price move.
There is no measuring technique for forecasting declines; other aspects of technical analysis should be used for estimating price targets.
Types of Rising Wedges

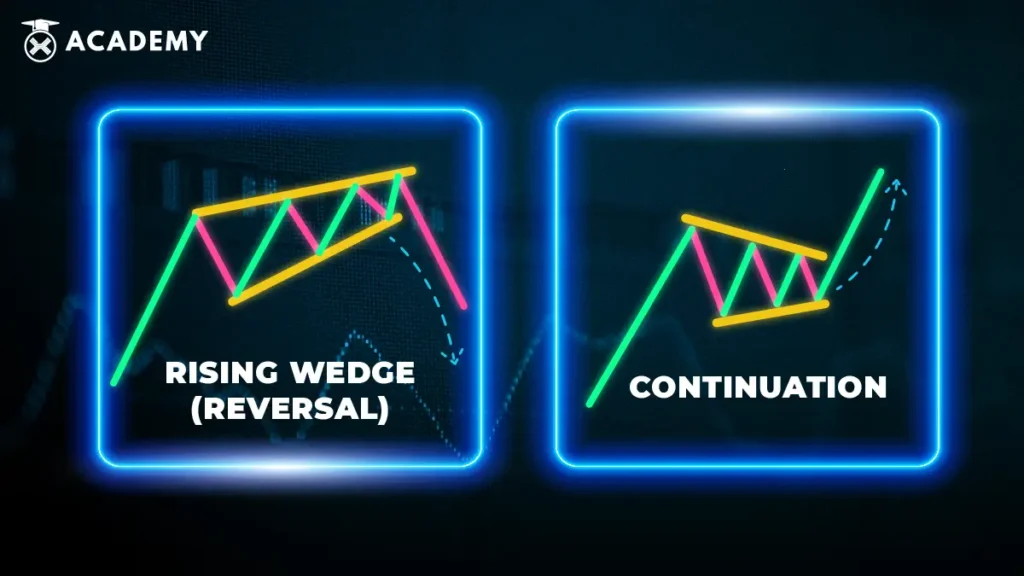
There are two types of Rising Wedge, namely reversal and continuation.
Reversal is a pattern formed when a bullish trend and prices consolidate to form a rising wedge pattern. After that the price will reverse direction and become bearish.
The Rising Wedge reversal pattern is formed when the candlestick reaches its highest point with the formation of a trendline pattern of converging lows and highs.
While the continuation pattern is a type of pattern that is formed when the price trend is bearish, then consolidation occurs and includes a Rising Wedge pattern.
There are three important characteristics of this pattern that you need to know. First, this pattern has two resistance points.
Furthermore, the Rising Wedge pattern has a conical shape, is not precise, and has a high degree of accuracy.
This pattern still needs to be identified accurately because the Rising Wedge chart illustrates price consolidation. Still, there is no upside momentum at each of the highs, making the pattern bias.
How to Understand the Rising Wedge
Getting to know the rising wedge pattern can be made by eliminating all wedges in a sideways trading environment.
This chart pattern can be positive in a downtrend as the price corrects higher and the trend increases.
Pros and cons of Rising Wedge
It should be noted that the Rising Wedge pattern also has advantages and disadvantages that must be considered before being applied to a trading system.
Pros of Rising Wedges
Like most price patterns, the two slices are subjective. Very flexible asset price patterns can be used on various pairs and timeframes.
- The rising Wedge is easy for experienced traders to identify.
- A rising Wedge often occurs in financial markets. It is profitable for traders.
- Rising Wedge clearly defines stop, entry, and limit levels.
- The Rising Wedge has the opportunity for a favorable risk-reward ratio.
Cons of the Rising Wedge
Because there are no definite standards, each trader’s rules for opening and closing positions will differ.
- This can make novice traders ambiguous and doubtful.
- The rising Wedge still needs to be identified.
- The rising Wedge is not an independent technical indicator because it requires additional confirmation using other technical indicators and oscillators.
Apart from knowing the advantages and disadvantages, You also need to be aware of the existence of a cut loss to avoid losses when using the Rising wedge Pattern with an uptrend.
It would be best to place a stop loss below the support line.
It can be concluded that the Rising Wedge pattern is in the form of a trend reversal and continuation trend reversal in the candlestick pattern. It will continue the trend if it breaks out on the support line.
Due to its flexibility, the Rising Wedge pattern allows traders to make almost limitless trading system settings.
So that all traders, from beginners to professionals, can use this slicing pattern to get a reliable trading formula.
After reading this review, Are you interested in looking for the Rising wedge pattern on the Indodax market page?
At Indodax Academy, apart from learning trading patterns, you can also learn how to read crypto charts, you know, and if you want to trade bitcoin, then see the price on the Indodax Market.


 Polkadot 8.91%
 BNB 0.45%
 Solana 4.80%
 Ethereum 2.37%
 Cardano 1.65%
 Polygon Ecosystem Token 2.13%
 Tron 2.85%
 Market


