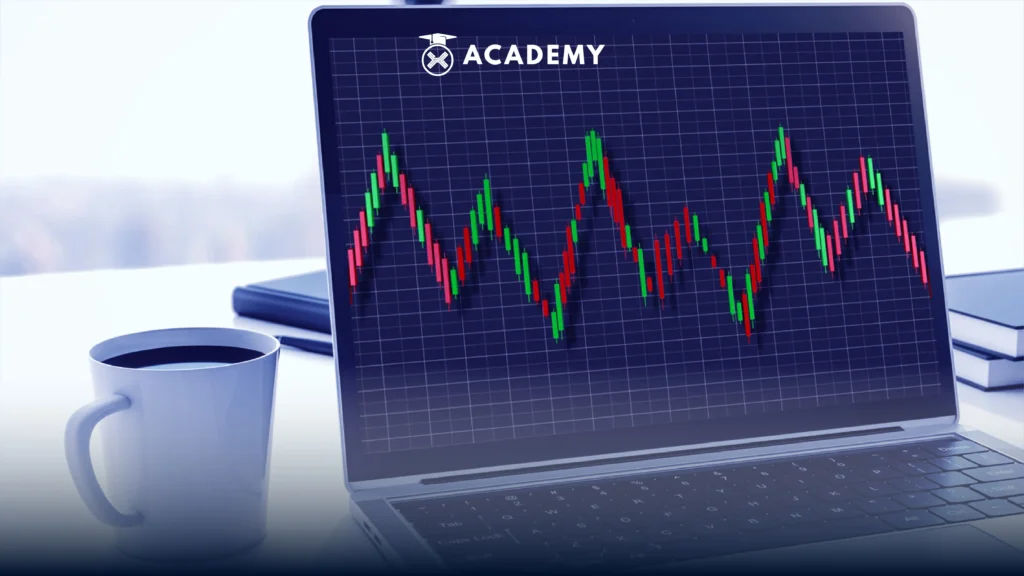
In digital assets, many terms describe market conditions, including sideways.
It is known that this term is often heard among several other terms, such as bullish and bearish.
Sideways can be interpreted as a market/market condition where the price range does not change much.
To discover what sideways means, let’s follow the review below.
What is Sideways?

Sideways is a condition when the price movement of an asset tends to move sideways in a horizontal direction; in this case, sellers and buyers have the same amount.
This condition occurs because supply and demand figures are equally strong in a certain period.
When this trendless market occurs, the market is in a consolidation phase.
This phase aims to find new price movements, namely up or down, after being in a certain trend.
However, people will only know if the market will go up/down after this sideways condition.
This is also a challenge for traders always to be careful when dealing with these conditions.
Besides that, sideways are often a reason for traders to refrain from trading to avoid unexpected risks temporarily.
Sideways indicator
Sideways have an indicator as a detector. Some of the sideways indicators are as follows:
1. Overlay Indicator
The first indicator is further divided into 3, namely:
- William’s Alligator indicator
The William’s Alligator indicator detects sideways through a sideways line.
In this case, a trend is formed if the plot moves in the opposite direction.
On the other hand, if the plots move overlapping, sideways are occurring in the market.
- Bollinger Bands indicator
The Bollinger Band indicator detects sideways when the chart forms a horizontal channel with increasingly narrow channels.
If that’s the case, investors or traders must wait until the Bollinger Bands occur.
Parabolic SAR indicator
Next is the parabolic SAR, which can also detect sideways.
On this indicator, the closer and smoother the signal point is to the price chart, the easier it is to detect a sideways condition in a market.
2. Oscillator Indicator
The second sideways indicator is the oscillator indicator. This indicator is divided into 3, namely:
- Accelerator Oscillator (AO) Indicator
In detecting sideways, this AO indicator serves to see if volatility is low or not.
- Relative Strength Index (RSI) Indicator
The following indicator, the Relative Strength Index (RSI), will detect sideways by showing the average ratio of the increase in the closing price.
The signal on this indicator is marked by the absence of divergent conditions or the market is experiencing sideways.
- Average Directional Index Movement (ADX) indicator
Meanwhile, the last indicator is the Average Directional Index Movement (ADX).
ADX is measured based on the movement of the main signal line at level 20.
When the signal is below the level, it is possible to detect a weakening trend and the price to move sideways.
Sideways features

The most important sideways feature is when the graph shows the path forming small mountains and valleys with short green and red colors.
This chart plot shows stable market movements or the market does not fluctuate.
However, if you trade at the same time under the same conditions, it will be risky. It can even harm you.
Please be careful before trading because sideways can be the right moment for traders to refrain from trading activities.
Advantages of Sideways
Sideways has several advantages, even though traders and investors often view this condition negatively. Here are the advantages:
1. The market structure is clear
Sideways usually have clearer resistance and support levels.
Thus, investors will be clear when entering and closing transactions.
2. Risk and Control
Investors can receive profits sideways, although they tend to be smaller than in normal conditions.
Furthermore, sideways also reduces the possibility of a position being negatively affected by an equally strong bearish, bullish, or other unexpected situation, such as an economic recession.
Disadvantages of Sideways
Meanwhile, some of the disadvantages of sideways are as follows:
1. Higher transaction fees
Sideway markets will generally generate more trading opportunities than trend trading.
When commodity prices increase, traders can use this to buy at the support phase and then sell at the resistance phase.
2. time-consuming
If traders often trade to make profits in the sideways market, this will be very time-consuming.
A trader must be able to determine “exit and entry” and place stop-loss orders.
Also, when entering a sideways trade, traders must always monitor it properly to ensure that the strategy is running correctly.
The reason is that many traders have strategies to streamline their time when trading.
Trading Strategy for Sideways Market
When sideways the stock market or crypto market, the trading strategy that can be done is to monitor market trends.
In this case, if the JCI is in a sluggish position or the movement is flat, it may be difficult for the commodity to rise.
If the commodity has a small volume and does not show positive sectoral movement—as is the case with the number of enthusiasts—then the commodity is not worth collecting.
However, on the contrary, if the sector’s movement shows a positive direction and the number of interested parties is large, traders can be prepared to buy.
Besides that, traders also need to look at the support and resistance. Usually, traders will prefer to wait until a breakout or support is confirmed.
Even so, behind the often confusing risks, sideways save traders profits.
Conversely, traders should not be in a long position when they see a flat market like this.
Sideways Disclaimer
It should be understood that some traders can take advantage of this situation by buying at the support level and selling at the resistance level.
Sideways trading can also be risky and difficult to predict because the highest price fluctuations are small and inconsistent.
Therefore, before investing or trading, it is important to consider the risks and potential benefits of the current market situation, including sideways conditions, and always do research and analysis before making an investment decision.
Conclusion:
Sideways is a condition when the price movement of an asset tends to be horizontal or flat; in this case, sellers and buyers have the same amount.
This condition occurs because supply and demand figures are equally strong in a certain period.
Some of the indicators on the sideway are the overlay indicator and the oscillator indicator.
The overlay indicator is divided into William’s Alligator, Bollinger Band, and Parabolic SAR indicators.
Meanwhile, the oscillator indicators are divided into Accelerator Oscillator (AO) indicators, Relative Strength Index (RSI) indicators, and Average Directional Movement Index (ADX).
Furthermore, sideways has several advantages, including:
(1) market structure is clear as well
(2) risk and control.
The disadvantages in the following:
(1) higher transaction fees and
(2) time-consuming.
So, now you know what sideways is, from the definition to the trading strategy?
Furthermore, you can also read other interesting articles, such as crypto trading strategies for beginners.
Come on, read in full only at INDODAX Academy.


 Market


