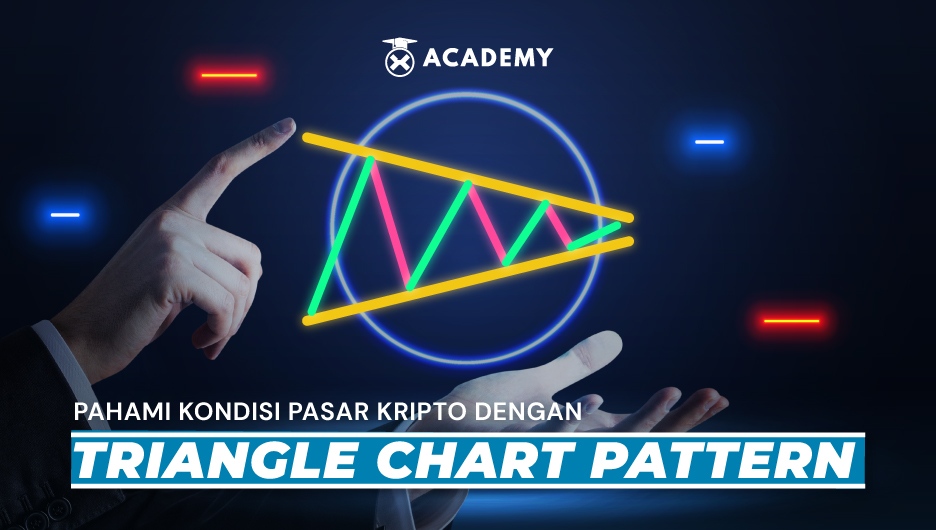
A triangle chart pattern is a chart pattern that crypto traders often use.
It is divided into two types, namely, ascending triangle and descending triangle.
These two patterns are continuation patterns, you know!
So what’s the difference?
Hello, back again with Fay at Indodax Academy!
This time Fay wants to discuss the triangle chart pattern.
The triangle chart pattern is included in technical analysis and has a function to help traders understand market conditions and predict whether the market price trend will remain or reverse.
Ascending triangles and descending triangles
The ascending triangle is a chart pattern used in technical analysis. Meanwhile, the descending triangle is a triangle pattern that shows a bearish chart.
Ascending triangle pattern
This pattern arises due to price action allowing a horizontal line to be drawn along swing highs and an upward trend line along swing lows.
The two lines then form a triangle. Usually, traders often pay attention to the breakout of the triangle pattern, and this breakout can be up or down.
The ascending triangle pattern is often referred to as a continuation pattern because it will usually break in the same direction as the trend occurred just before the triangle was formed.
The ascending triangle pattern can provide clear entry points, profit targets, and stop-loss levels.
After a triangle breakout occurs, traders usually tend to aggressively buy or sell the asset, depending on which way the price breaks out.
It takes a minimum of two swing highs and two swing lows for an ascending triangle trend line to form.
The volume will usually be more substantial during trending periods than consolidation periods.
Triangles are a type of consolidation, and as such, volume tends to be stressed during ascending triangles.
Descending triangle pattern
This triangular pattern shows a bearish chart, which means this pattern is present when the price is down or downtrend.
Often used in technical analysis, this pattern is designed by drawing one trend line connecting a series of lower highs and a second horizontal trend line connecting a series of lows.
So, after the breakdown, traders will enter short positions and aggressively help push the asset price even lower.
The descending triangle pattern can form an uptrend reversal pattern but is generally seen as a Bearish continuation pattern.
So, how is it? Now you understand more about the two types of triangle chart patterns, namely ascending triangles and descending triangles.
Keep up with Indodax Academy for other interesting videos! Bye!
Subscribe to Indodax YouTube


 Polkadot 9.78%
 BNB 0.37%
 Solana 5.77%
 Ethereum 1.84%
 Cardano 1.53%
 Polygon Ecosystem Token 2.91%
 Market


