
In the world of trading, a trader’s ability to read market movements is the most crucial factor. This skill can determine the amount of profit that can be obtained.
Not only that, several technical analyzes that traders often use as indicators must also be observed. One of them is to see the potential for price reversals in digital assets, namely the Wedge Pattern.
Please note there are two types of Wedge Patterns, namely Rising Wedge Patterns and Falling Wedge Patterns. To find out more, we have thoroughly discussed the Rising Wedge pattern in Indodax Academy.
Now, after understanding the Rising Wedge pattern, it’s time for us to discuss the Falling Wedge pattern.
As with the Rising Wedge, this pattern also has a significant role in reading momentum and making profits.
What is the falling wedge pattern?

The falling wedge pattern is a pattern that appears when the price bounces between two trend lines and slopes downwards.
This pattern will be formed by support and resistance lines dropping downwards. The falling wedge is considered a bullish formation but can also be a reversal and continuation pattern.
This shows that every trader must be careful in reading this pattern to maximize trading results.
This pattern is a bullish pattern that widens at the top. The price change will look like a cone shape when the price decreases.
Falling wedges differ from symmetrical triangles because they have a definite downward slope and a bullish bias.
Despite all that, this pattern will still be considered a bullish pattern.
Falling wedge pattern criteria
The main feature of the falling wedge pattern is the volume that decreases when the channels meet. When that happens, buyers can take advantage and launch into even greater price action.
Here are the three main criteria for the falling wedge pattern to make it easier to understand.
- During a downtrend, at lower lows and lower highs, prices will be traded temporarily
- There are lower and upper trend lines that become convergent lines
- When the channel is growing, there is a decrease in the volume
The first two points are mandatory criteria for the falling wedge pattern. In comparison, the third criterion can help traders in trading.
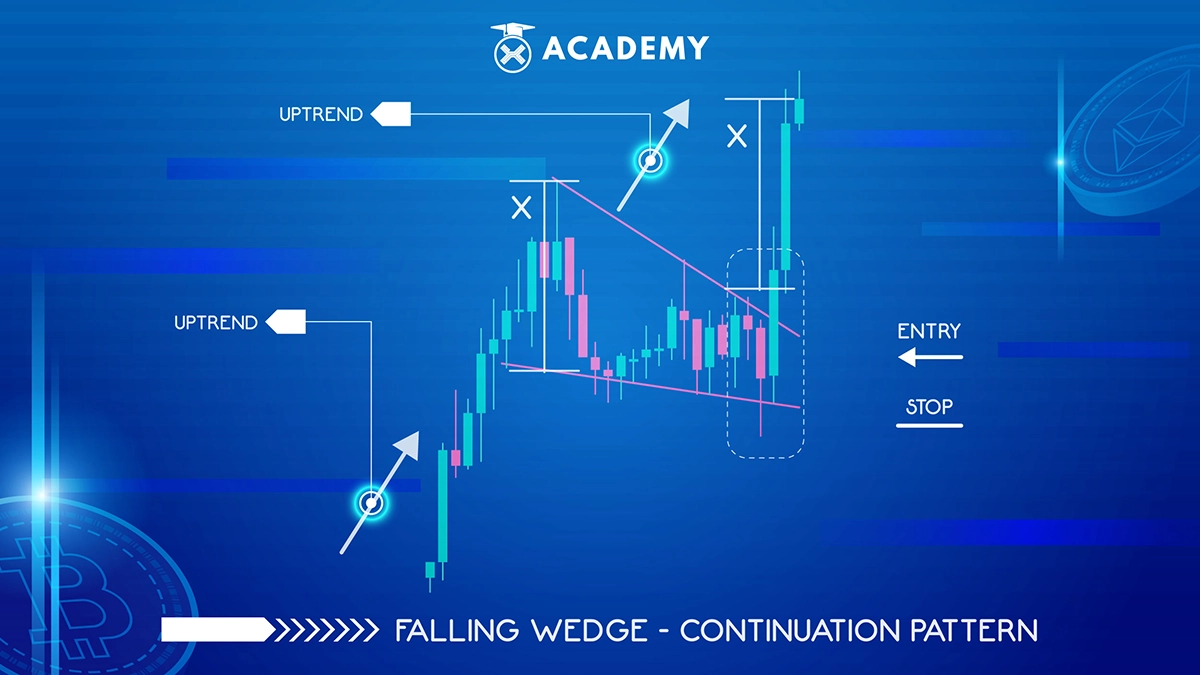
The falling wedge pattern is interpreted as a bullish continuation and a bullish reversal pattern, which creates confusion in pattern identification.
The differentiating factor that separates continuation and reversal patterns is the direction of the trend when a falling wedge appears.
A falling wedge is a continuation pattern if it appears in an uptrend and is a reversal pattern if it appears in a downtrend.
Features of continuation and reversal patterns:
- Identify an uptrend or (downtrend)
- Connect lower highs and lower lows using trend lines. The two lines will form a downward-sloping wedge and meet.
- Look for the difference between the price and an oscillator, such as the RSI or the stochastic indicator.
- Other technical tools, such as oscillators, can confirm oversold signals.
- Look for a break above the resistance line for long entries
Falling wedge pattern accuracy
The falling wedge pattern is one of the most difficult chart patterns to recognize. A falling wedge is considered a reliable and accurate chart pattern and can help traders predict the next price movement.
Research suggests that a Falling Wedge pattern breaking in the direction of the reversal could be considered a bullish breakout, while a bearish breakout leads to a rising wedge.
Thus, the falling wedge pattern is a more reliable indicator than the rising wedge pattern.
How to trade with the falling wedge pattern

In essence, the Rising and falling wedge patterns can be used according to your trading strategy.
Through these two patterns, traders can estimate the time to open a position, stop a stop loss, and consider the profits and risks in trading.
In short, here are the right steps for trading using the wedge pattern.
Reduce risk and target
A trader must be able to consider the risk of profit and loss before starting trading. These two factors depend on the trader’s fund and risk profile.
Open and close positions using the wedge pattern
Before opening a trading position, it’s a good idea for traders to confirm the pattern first. You do this by waiting for a breakout to occur.
When the price crosses the upper trend line on a downward movement, traders are advised to buy the asset immediately.
Conversely, if the price crosses the lower trend line during an upward movement, it is an excellent time to sell the asset or close its position.
Determine stop and loss with the wedge pattern
Traders can place a stop loss at the highest price of an asset. But if the movement is still declining, traders are advised to sell their assets immediately,
Confirm a strong wedge pattern
There are two ways to avoid fake wedge patterns and ensure the real one.
The first way, make sure the volume value of asset trading. An increase in price accompanied by a decrease in volume means a price reversal is imminent.
The second way is to ensure the asset price movement toward the Fibonacci retracement level. If the asset price is still below 50 percent of that level, then the rising wedge pattern is valid and can be used as a reference.
Conclusion
From here, it can be concluded that the falling wedge pattern is in the form of a trend reversal and continuation trend reversal in the candlestick pattern, which will continue the trend if it breaks out of the resistance line.
Like the rising wedge pattern, the falling wedge pattern can also help traders get maximum trading results.
However, traders must be careful in reading patterns, seeing momentum, and determining the strategy to be used when trading.
After reading this review, are you interested in learning about other types of technical indicators in the world of trading, such as divergence patterns to cup handle patterns?
You can read the complete information at Indodax Academy!
 Market

