
In the world of trading, including crypto assets, several candlestick patterns will help traders, including the gravestone doji pattern.
This pattern is even referred to as a type or doji candlestick pattern, which can accurately show trend reversal signals.
So, what is a gravestone doji, and how to read it? Find the answer in the following review!
What is a Gravestone Doji?

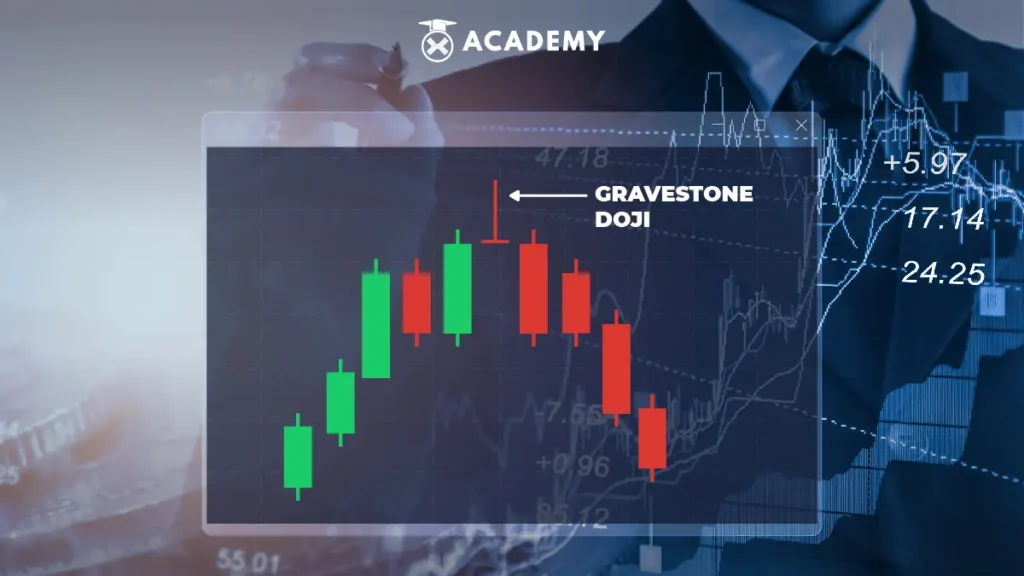
Gravestone Doji is a bearish reversal candlestick pattern.
This pattern usually forms at the end of an uptrend. When the market is in an uptrend and this doji pattern forms, it gives an initial signal that the trend will reverse downward.
The gravestone doji appears when the opening price (open price), lowest price (low price), and closing price (close price) are at the same price.
The thing that needs to be highlighted in this type of Doji is its long upper tail (shadow).
The reason is it shows that the market is testing potential resistance.
It is also important to note that this candlestick pattern is created when buyers try to push the price by making purchases.
However, on the other hand, sellers held the price at resistance and pushed the cost to the reopening price so that the uptrend was halted because the seller’s action was resistant.
How to Identify a Gravestone Doji
Identifying this pattern, in general, is quite easy.
That’s because Gravestone Doji consists of only one candlestick.
In addition, this candlestick has a shape that attracts attention, so it’s easy to find.
As a way to identify it, five (5) steps can be taken, with explanations as follows.
1. Pay attention to the opening and closing prices
In the doji gravestone candlestick pattern, the opening price (open price) and closing price (close price) are important components.
The open price is the price reached when the trading session begins, while the close price is the price reached when the trading session ends.
At the gravestone doji, the open and closing prices are at the same/almost the same value.
This shows an attempt on the part of the buyer to push the asset price even higher, but this attempt was defeated by stronger selling pressure, so the price was forced to close at the same position/closer to the opening price.
This indicates that buyers and sellers are equally strong, and no one dominates the market.
Therefore, the market is sideways and can move in a different direction anytime.
2. Pay attention to the upper axis
The long upper axis of the gravestone doji shows commodity prices that have touched their highest levels in a certain period.
However, it returned and closed at the same/closer to its opening price.
This condition indicated that sellers exerted strong pressure, pushing asset prices down even though they had reached their highest levels.
This pattern is considered a bearish signal and can indicate a potential reversal of asset price direction.
3. Pay attention to previous trends
To form a gravestone doji pattern, the previous trend must be an uptrend.
In this uptrend, commodity prices generally increase and show strong buyer interest.
However, there is no less intense selling pressure from sellers at certain periods.
This condition prevented asset prices from reaching higher levels and instead fell.
Apart from that, this situation is also considered a bearish signal and can be used to indicate a potential reversal of asset price direction.
However, to provide stronger confirmation, traders must pay attention to the trends before and after the gravestone doji was formed.
The goal is to determine whether this pattern is a reversal signal or a correction in an uptrend.
4. Watch the trading volume
Meanwhile, the low trading volume shows low interest from buyers and sellers, so that the potential for a trend reversal is more significant.
In this case, the trading volume must be high when the gravestone doji pattern is forming.
This shows that a lot of trading activity occurs, and buyers and sellers try to control prices.
Trading volume can form a gravestone doji pattern when there is an intense battle between buyers and sellers.
If the trading volume is high, a lot of trading activity is going on, and buyers and sellers are trying to control prices.
However, if the sellers successfully push the price back to the opening level, they have more power in the short term, and a gravestone doji pattern could form.
5. Confirm with another pattern
After the gravestone doji pattern is formed, the price movement will confirm whether this pattern is a reversal signal.
If the price moves down after the gravestone doji pattern forms, this indicates that this pattern is a reversal signal.
Conversely, if the price continues to rise after the formation of the pattern, then it shows that the gravestone doji pattern may not be valid as a reversal signal.
Please note this pattern must be confirmed with other patterns, including bearish candlesticks or other technical indicators, for example, the Moving Average, RSI, MACD, and others, to confirm the formation of the gravestone doji pattern and know the validity of the signal given by this pattern.
How to Use Gravestone Doji in Trading
Like how to identify it earlier, how to trade with this pattern is quite easy to do.
There are 2 (two) ways that you can at least do, namely:
- First, relying on this type of doji and confirmed by technical indicators (without looking at the price structure and important levels).
- Second, trading using this doji as an entry signal at an important level after first looking at the price structure.
The following is an explanation of each method.
1. Relying on the gravestone doji and confirmed by technical indicators
Traders can wait for this gravestone doji pattern to form first and then look for short positions as a parameter for a trend reversal.
However, traders need to confirm this pattern with technical indicators. Here’s the guide.
- Bearish Gravestone Doji pattern
Bearish candles are the most common form of the gravestone doji pattern. Traders will generally use this pattern to enter short positions/as a sign of exiting long positions.
As expected, a bearish gravestone doji pattern appeared at the top of an uptrend, signaling that the market trend might change soon.
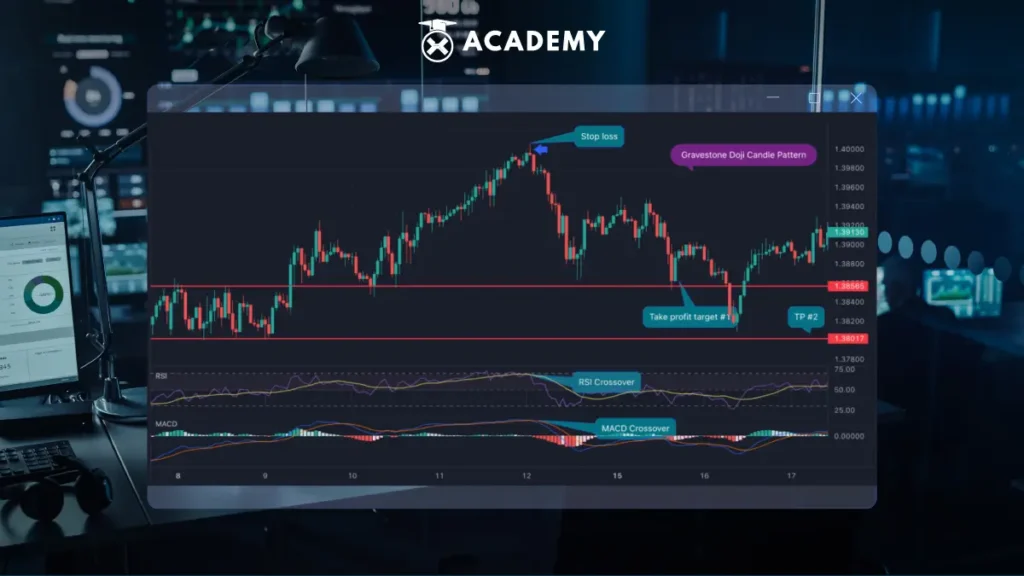
The example above shows a bearish doji gravestone forming at the top of a trend and indicating a selling opportunity.
In this case, traders can use the RSI and MACD indicators to confirm the reversal signal.
The function of the RSI and MACD indicators here is to confirm a trend reversal.
However, the most important reference is the presence of the next candlestick after the gravestone doji pattern.
If the next candle is bearish, then it is likely that the trend reversal will be confirmed.
Furthermore, a stop loss can be placed above the highest price of the gravestone doji pattern.
Meanwhile, TP can be placed at the next support level.
- Bullish Gravestone Doji pattern
Different from the bearish gravestone doji, this bullish gravestone doji pattern is even less reliable.
The reason is, this pattern has 2 meanings, namely as a signal of reversal or trend continuation.
Traders can use the RSI and MACD indicators to confirm this pattern.
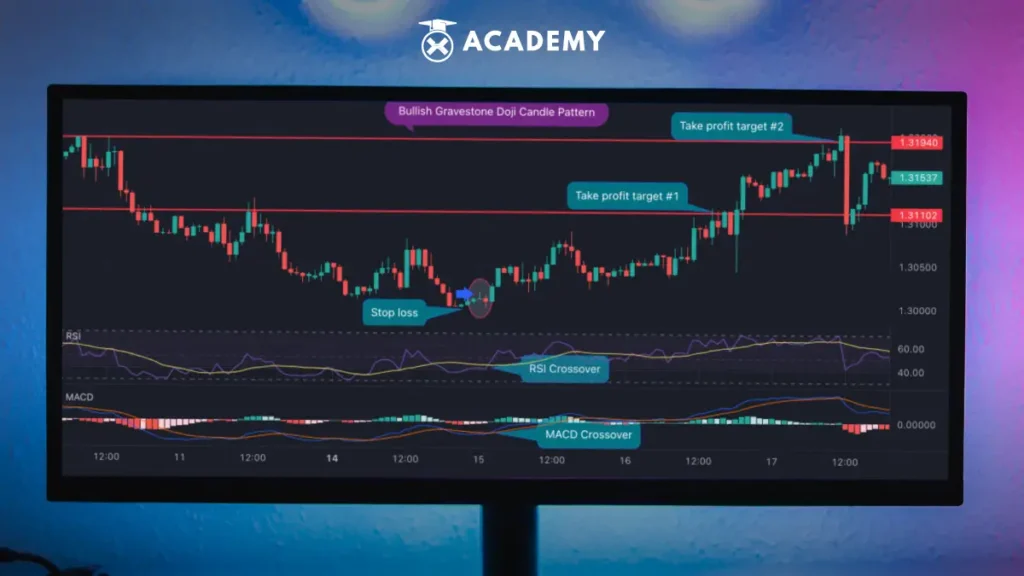
It can be seen in the chart above that the gravestone doji is present at the bottom of the downtrend and indicates the end of the bullish sentiment.
Meanwhile, the RSI and MACD indicators show a crossover indicating that the price will soon be bullish.
So, the reversal from bearish to bullish can be confirmed. The stop loss can be placed below the lowest gravestone doji, and the profit target is at the next support level.
2. Using gravestone doji by looking at the price structure
The second way is quite safer and more profitable. As a reminder, there are two market structure types: trending and sideways.
Trending is also divided into two types: the trend up and down. Meanwhile, the sideways price structure can be seen from the price moving back and forth within a certain range.
A sideways condition is a condition without direction. On the other hand, an uptrend is marked by higher highs and higher lows.
However, on the contrary, a downtrend will be marked by lower lows and lower highs.
Among the trending types above, a downtrend is the best for trading with Gravestone Doji.
This is because the doji gravestone pattern used in the downtrend is a more optimal way. After all, the market is dominated by sellers.
Meanwhile, the gravestone doji pattern indicates that seller pressure is strengthening.
Thus, the very first step that can be taken is to ensure that the chosen trading pair/instrument is in a downtrend.
After knowing the structure, traders can use the resistance level as a selling area.
However, the resistance level used to sell here is the support level that has been broken and becomes resistance (support becomes resistance).

When these criteria are met, traders only need to wait for the gravestone doji pattern to form when testing the resistance level.
To understand it, please refer to the steps below:
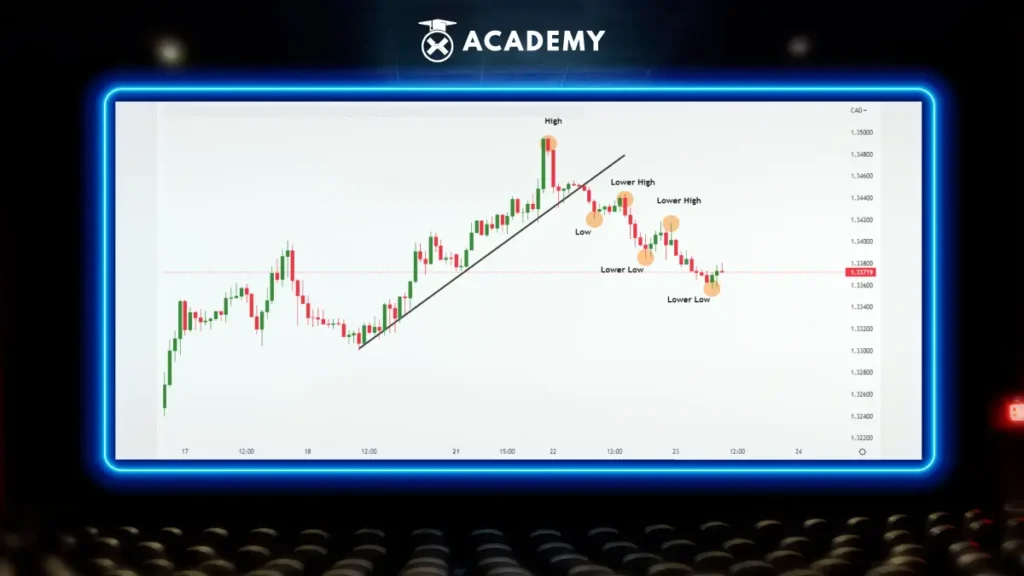
From the USD/CAD H1 chart above, the uptrend has changed to a downtrend. A lower low and lower high mark it.
Then, traders must search for a good resistance level for short positions. In the following example, there is a good resistance level at 1.34170, previously a support level in an uptrend.
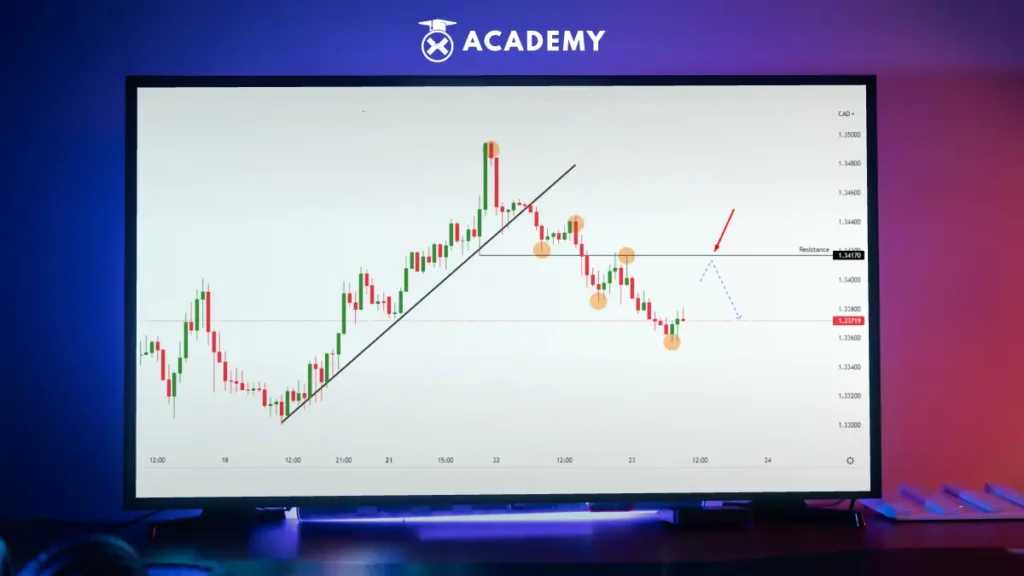
Next, traders must wait until the gravestone doji pattern is formed to test the resistance level at 1.34170.
After the pullback price tested resistance and succeeded in forming a gravestone doji, short positions can be executed.
Then, stop loss (SL) can be placed above the highest price of the gravestone doji candle and take profit (TP) at the next support level.
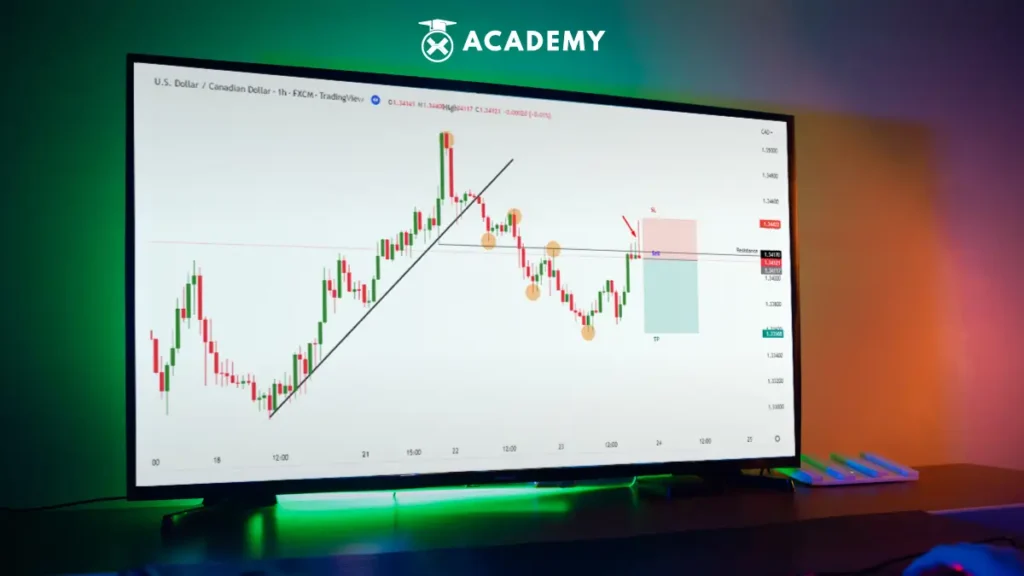
It can be seen from the image above that the price briefly fluctuated but remained stuck at the resistance level of 1.34170 before dropping to the TP area of 1.33535.
So, short positions were successfully closed with profit conditions. For information, this second method will be even better if the downtrend continues to strengthen.
Thus, the potential profit traders earn will also be higher because a strong downtrend indicates that seller pressure is more aggressive, so the price moves deeper.
Trading Rules Using the Gravestone Doji Pattern
When you trade using this pattern, there are several rules that you need to know and understand, namely:
- When the price increases to touch the resistance level, wait for the price to form a gravestone doji pattern.
- When a Gravestone Doji forms, place a sell stop 2-3 pips below the lowest price of this Doji pattern. If there is a break, then the sell position enters
- Place a stop loss 3-5 pips above the high of the gravestone doji
Use the previous swing low as a profit target
Meanwhile, the trading strategies that can be used to seize profit opportunities with the gravestone doji pattern are as follows:
1. Short selling
After forming a gravestone doji in a strong uptrend, traders can open short positions (sell). The expectation is that the price will move down.
However, traders also place a stop loss above the highest price of the gravestone doji pattern to anticipate unexpected price movements.
2. Purchase when the price drops
If the gravestone doji pattern has been formed, traders can wait for prices to fall before taking action to open buy positions.
This will provide a lower purchase price and trading risk should the price continue to fall.
3. Placement of stop loss orders
After this pattern is formed, traders must place a stop-loss order below the lowest price of the gravestone doji pattern.
This will limit losses if the price continues to fall after the pattern has formed.
4. Placement of take-profit orders
After the gravestone doji is formed, traders can place a take-profit order at the desired price level.
This will allow traders to take profits if prices move as expected.
5. Portfolio diversification
Gravestone doji is just one of the many signals that can be used in technical analysis and must be combined with other analyses, including fundamental analysis and market sentiment, to make the right trading decisions.
Meanwhile, portfolio diversification can help reduce risk while maximizing trader profit potential.
The Importance of the Level when the Gravestone Doji Pattern is Formed
When a gravestone doji pattern forms at a resistance level/zone, the pattern will have a more specific meaning than when it forms at a resistance level.
Therefore, you cannot take entries in every gravestone doji pattern formed as a trader because the place/level is so important.
Conclusion
Gravestone doji is a bearish reversal candlestick pattern that usually forms at the end of an uptrend.
Gravestone doji is created when the opening price (open price), lowest price (low price), and closing price (close price) are at the same price.
With this type of Doji, the thing to watch for is its long upper tail (shadow), which indicates that the market is testing potential resistance.
So, now you understand what a gravestone doji is and how to read its pattern.
Apart from the gravestone doji pattern, you can also learn candlesticks and accurate candlestick patterns to reversal candlestick patterns at INDODAX Academy.
If you already understand the various types of candlestick patterns, now is the time to invest in crypto.
However, before starting an investment, you should check the price of crypto assets on the INDODAX Market.
 Market

