Amidst the ever-changing dynamics of the crypto market, having a reliable analysis tool is a must. One of the technical indicators that is often relied on by experienced traders is the Ichimoku Cloud.
This indicator is able to provide a comprehensive perspective on trend direction, momentum strength, and support and resistance points in one comprehensive graphic display.
Let’s learn more about what the Ichimoku Cloud is and how to use it to optimize your trading strategy!
What is the Ichimoku Cloud?
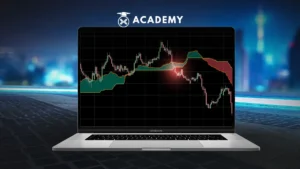
Ichimoku Cloud, or in full Ichimoku Kinko Hyo, is a technical indicator that provides a comprehensive overview of market movements.
In one graphical display, this indicator is able to show areas of support, resistance, trend direction, and the strength of market momentum. The advantage of this indicator lies in its ability to effectively filter market “noise”.
In addition, Ichimoku Cloud also provides a view forward and backward simultaneously, making it more suitable for trend-following strategies than short-term analysis.
Historically, Ichimoku Cloud was first developed by Goichi Hosoda, a Japanese journalist, in the late 1930s.
After going through various refinement and testing processes for decades, this indicator was finally officially published in 1969.
Even though it is almost a century old, Ichimoku remains relevant and even more popular in the world of modern asset trading, including crypto and stocks.
The full name of this indicator in Japanese is Ichimoku Kinko Hyo, which literally translates to “a glimpse of the balance chart”.
This name reflects its main function as an analysis tool that is able to provide direct and comprehensive visual information about current market conditions.
Therefore, many traders use Ichimoku because of its comprehensive appearance and ability to present various technical data in one chart.
This indicator is also widely used not only by professional traders, but also beginners who want to apply a disciplined technical system in analyzing the crypto, forex, and stock markets.
Ichimoku Cloud is known to be very effective when the market is in a clear trend, but less optimal when the market is in a sideways or consolidation phase.
Also read related articles: What is Sideways and What is the Trading Strategy when Sideways?
Main Components of Ichimoku Cloud
To understand how the Ichimoku Cloud indicator works effectively, you need to know the following five main components:
1. Tenkan-sen (Conversion Line): Short-term Moving Average
Tenkan-sen is a line that shows the midpoint between the highest and lowest prices in the last nine periods.
Because its calculation is based on a short period, this line moves most responsively to price changes, making it ideal for monitoring short-term trends.
The slope of this line can be used as a signal of the strength of the direction of price movement.
Formula:
Tenkan-sen = (High9 + Low9) / 2
2. Kijun-sen (Base Line): Medium-term Moving Average
Kijun-sen is a line obtained from the average between the highest and lowest prices in the last 26 periods, which represents approximately one month of trading in Japan with six working days per week.
When compared to Tenkan-sen, this line tends to be more stable and functions as a guide to trend direction and a dynamic support-resistance reference.
Formula:
Kijun-sen = (High26 + Low26) / 2
?
3. Senkou Span A: The first front line that forms the cloud
Senkou Span A is the average of Tenkan-sen and Kijun-sen, then the result is shifted forward by 26 periods. This line forms the upper or lower boundary of the cloud, depending on its relative position to Senkou Span B.
Formula:
Senkou Span A = (Tenkan-sen + Kijun-sen) / 2 (shifted 26 periods forward)
?
4. Senkou Span B: The second front line that forms the cloud
Unlike Senkou Span A, this component takes the midpoint of the highest and lowest prices over the last 52 periods, then shifts it forward by 26 periods.
Senkou Span B tends to be more stable and slow to change so it can provide important information about support and resistance areas in the long term.
Formula:
Senkou Span B = (High52 + Low52) / 2 (shifted 26 periods forward)
5. Chikou Span (Lagging Span): Closing price shifted backward
Chikou Span is created by plotting the current closing price 26 periods backward. This component plays a role in ensuring the validity of the trend direction while assessing how strong the momentum of the price movement is.
When this line is above the previous price, it indicates a solid upward trend. Conversely, the position of the line below the historical price indicates a stronger downward trend.
Formula:
Chikou Span = Current Closing Price (shifted 26 periods backward)
Also read related articles: Best Trading Indicators for Market Analysis
How to Read the Ichimoku Cloud
To be able to make the most of the Ichimoku Cloud in technical analysis, you need to understand how to read each of its components.
Each element in this indicator provides different information that complements each other, from trends, momentum strength, to potential support and resistance areas. Here is a basic guide to reading the Ichimoku Cloud:
1. Interpretation of the Cloud (Kumo) as a Support or Resistance Area
The Kumo, or cloud, is formed from two lines, namely the Senkou Span A and Senkou Span B. When the price is above the Kumo, the cloud functions as a dynamic support area.
Conversely, if the price is below the Kumo, it becomes resistance. Traders often use the position of the price relative to the Kumo to assess the strength of the trend direction.
2. Crossing the Tenkan and Kijun Lines as a Buy/Sell Signal
The crossing between the Tenkan Sen and Kijun Sen is usually used as an indication to enter a position. If the Tenkan Sen breaks above the Kijun Sen, this is often interpreted as a buying opportunity.
Conversely, when Tenkan Sen crosses below Kijun Sen, it can be a sell signal. This signal is stronger if it occurs above or below Kumo, according to the direction of the main trend.
3. Location of Price to Cloud (Above, Within, or Below)
The position of price to cloud is very important. When price movement is above Kumo, market conditions are usually interpreted as a trend that is strengthening upwards. If the price is below Kumo, the market is in a downtrend.
Meanwhile, if the price is in the cloud, the market is in a consolidation or sideways phase, and the signal becomes less clear.
4. Cloud Thickness Shows Trend Strength
The thickness of Kumo reflects the strength of the trend. The thicker the cloud, the stronger the potential support or resistance, and the more difficult it is for the price to penetrate the cloud.
Conversely, a thin cloud indicates weak support or resistance so that it is easier to penetrate by price movements.
Trading Signals from Ichimoku Cloud
In technical analysis using Ichimoku Cloud, trading signals are formed based on a combination of price positions against the cloud (Kumo) and the interaction between the Tenkan Sen and Kijun Sen lines. Here are three main types of signals that are commonly used:
1. Bullish Signal
A buy signal appears when the price is above the cloud and the Tenkan Sen line crosses above the Kijun Sen. This condition indicates that an uptrend is underway and the momentum of price strengthening is quite strong.
The signal becomes stronger if it is also supported by the Chikou Span position which is above the historical price.
2. Bearish Signal
A sell signal occurs when the price is below the cloud, and Tenkan Sen crosses below the Kijun Sen.
This indicates a strong downtrend with increasing selling pressure. Additional validation can be seen from the Chikou Span position which is below the historical price.
3. Neutral/No Trade
When the price is in the cloud, it means that the market is in a consolidation or uncertainty phase.
In this condition, the signals generated tend to be weak or confusing so that many traders choose not to enter until the trend direction is more clearly visible.
Also read related articles: Bollinger Bands Width (BBW): Function & Trading Strategy 2025
Advantages and Limitations of Ichimoku Cloud
Although the Ichimoku Cloud is known as a comprehensive and information-rich indicator, its use has advantages and limitations that need to be well understood before being applied in a trading strategy, including the following:
Advantages
1.Provides a wealth of information in one indicator
Ichimoku Cloud combines various important information in one indicator, such as trend direction, support and resistance levels, and market momentum.
With its complementary components, such as Tenkan Sen, Kijun Sen, and Senkou Span, traders can get a comprehensive picture of market conditions without having to use many separate indicators.
2.Suitable for trend-following strategies
This indicator is very effective for trend-following strategies, as it can clearly show whether the market is in an uptrend or downtrend.
In addition, this indicator also provides an overview of potential future market movements, allowing traders to identify possible trend continuations or trend reversals before they occur.
3.Its visualization makes it easier to make decisions
With a clear and comprehensive display, Ichimoku Cloud allows traders to easily recognize market direction, support and resistance levels, and ongoing momentum.
It helps in making quick decisions, especially in dynamic market situations.
Limitations
1.Less accurate in sideways market conditions
Although very effective in trending markets, the Ichimoku Cloud does not perform well in sideways or consolidating markets.
In these conditions, the indicator can produce mixed or unclear signals, which increases the risk of false signals or confusion for traders.
2.Looks complicated for beginners
The Ichimoku Cloud consists of many overlapping lines, which can be confusing for novice traders. Understanding how each component works and how they interact takes time and practice.
Beginners may find it difficult to decide on the right investment strategy based only on a chart full of information.
Example of Using Ichimoku Cloud in Crypto Trading
Ichimoku Cloud is a useful indicator in crypto trading to analyze trends and support-resistance levels.
This example shows how to detect a change in trend direction in Bitcoin and confirm the validity of the signal with the help of supporting indicators such as trading volume and RSI.
1. Simple Case Study: Bitcoin (BTC) Breaks Through the Cloud? Indication of Trend Change
For example, the price of Bitcoin (BTC) suddenly breaks through the upper limit of the Cloud (Kumo) which usually functions as a resistance level. When the price is above the Cloud, it indicates that the market trend may change from bearish to bullish.
This could be an indication that Bitcoin will continue its price movement in a higher direction. To ensure the accuracy of this signal, traders need to confirm it with increasing trading volume.
In addition, checking other indicators such as the Relative Strength Index (RSI) can help ensure that the new trend is not in an overbought condition.
With this confirmation, the signal from the Ichimoku Cloud becomes stronger and more reliable in making trading decisions.
2. Tips: Confirmation with Trading Volume and Additional Indicators Such as RSI
Signals from the Ichimoku Cloud that indicate a change in trend need to be confirmed by confirmation from other indicators.
For example, if Bitcoin breaks through the Cloud and the RSI shows overbought conditions, this could be a signal that the price may soon experience a correction.
Conversely, if trading volume increases after breaking through the Cloud, it could increase confidence that a bullish trend is starting.
Always make sure to combine several indicators to minimize risk and increase the chances of success in crypto trading.
Practical Tips for Optimizing the Ichimoku Cloud
Here are some practical tips for optimizing the use of the Ichimoku Cloud in trading:
1. Use a daily time frame for higher accuracy
The Ichimoku Cloud works very well on larger time frames, such as daily, because it provides a clearer picture of the long-term trend.
In crypto trading, price fluctuations can be very fast, and by using a daily time frame, traders can avoid the noise that often occurs on smaller time frames, thus getting more accurate and reliable signals.
2. Don’t rely solely on Ichimoku, combine it with price action analysis
Although the Ichimoku Cloud provides a lot of information, no indicator is perfect. Therefore, it is highly recommended to combine Ichimoku with price action analysis.
For example, checking candlestick patterns or support and resistance levels can provide further confirmation for more precise trading decisions.
3. Practice cloud interpretation on a demo account before real trading
Before applying the Ichimoku Cloud to a real trading account, it is important to practice on a demo account first.
This allows traders to understand how the cloud works in various market conditions without the risk of losing money.
Mastering the interpretation of the various components of the Ichimoku Cloud in practice will increase confidence and the ability to make better trading decisions.
Conclusion
So, that was an interesting discussion about Getting to Know Ichimoku Cloud: A Guide to Understanding Trading Indicators that you can read in full at the Crypto Academy at INDODAX Academy.
In conclusion, Ichimoku Cloud is an effective technical analysis tool to help traders understand trends, support-resistance levels, and market momentum, especially in crypto trading.
By knowing how to read and use the components in Ichimoku correctly, you can make more focused and precise trading decisions.
And not only does it increase your insight into investment, here you can also find the latest crypto news about the crypto world.
And for an easy and safe trading experience, download the best crypto application from INDODAX on the App Store or Google Play Store. Also follow INDODAX’s social media here: Instagram, X, Youtube & Telegram
FAQ
1.What is the main function of Ichimoku Cloud?
Ichimoku Cloud helps traders see the direction of trends, momentum, and support and resistance levels in one graphic display.
2.Can Ichimoku Cloud only be used for crypto trading?
No. Ichimoku Cloud can be used on a variety of instruments, including stocks, forex, and commodities.
3.What is the best time frame to use Ichimoku Cloud?
Usually the daily time frame is considered the most accurate to get more valid signals.
4.What does it mean if the price is inside the Cloud?
It means that the market is in a consolidation or uncertainty phase; it is better to avoid opening large positions.
5.Is Ichimoku Cloud suitable for beginner traders?
Suitable, as long as it is studied patiently because this indicator takes time to understand all its components.
Author: BOY



 Polkadot 8.81%
 BNB 0.43%
 Solana 4.77%
 Ethereum 2.37%
 Cardano 1.75%
 Polygon Ecosystem Token 2.11%
 Tron 2.85%
 Market
