This week, the bullish crypto lineup is led by Ethereum(ETH) in first place, followed by XRP(XRP) and SOLANA(SOL).
Want to know how your favorite crypto asset is performing? Check INDODAX Market Signal below!
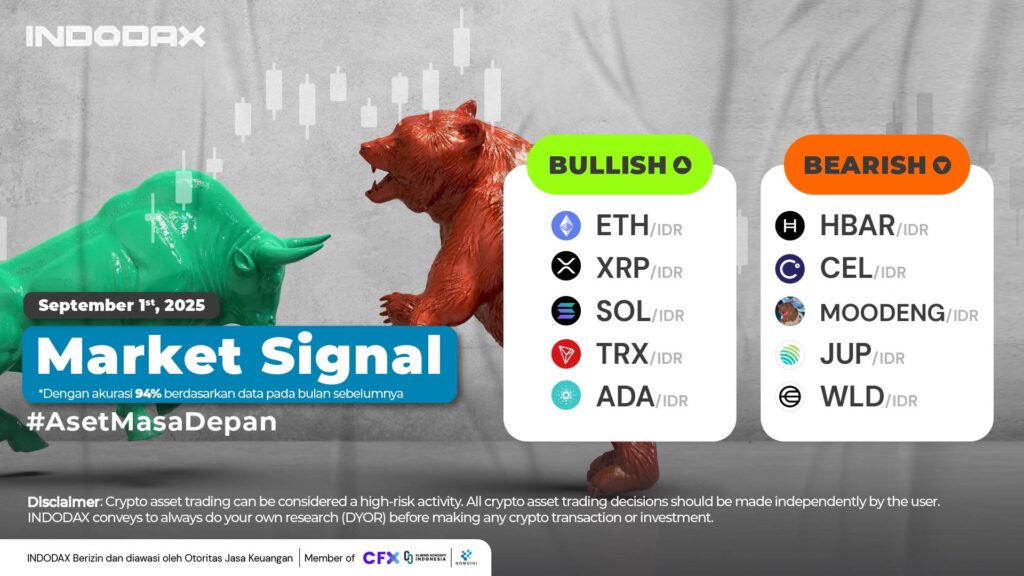
5 Bullish Crypto Assets
1.Ethereum (ETH)

Ethereum’s (ETH) weakening did not significantly impact the trend change. The absence of candles below the WMA/75 indicates that positive momentum still dominates Ethereum’s (ETH) price movements. The support level of 55,000,000,000 – 65,000,000 will be the level for Ethereum (ETH) if price weakness occurs, determining the direction of the candles on the WMA/75 line.
2.XRP (XRP)

Resistance is quite dominantly indicated to be in the range of 50,000 – 60,000 levels with the assumption that breaking through this level will create a positive trend intersection for XRP (XRP).
3.Solana (SOL)

On the 1 Day chart, it is shown that if Solana (SOL) is just in the Bullish phase, there is still a chance that Solana (SOL) will fail to survive in the current phase by returning to the trend to move below the 1,500,000 – 2,500,000 level.
4.Tron (TRX)

Tron (TRX) is still holding above the WMA/85, with the trend potentially strengthening trying to stay above the 6,000 – 6,500 area.
5.Cardano (ADA)

The MACD indicator shows that Cardano (ADA) is in a negative direction, with Cardano (ADA) currently still unable to strengthen, which has a direction towards the strength area of ????15,500 – 18,500.
5 Aset Kripto Bearish
1.HBAR (HBAR)

The Bearish trend will dominate price changes with the formation of a complete Candle below the Support area of ??3,000 – 3,500, confirming that the HBAR (HBAR) will be in a negative direction.
2.Celsius (CEL)

A trend improvement in the Bearish phase will be formed, Candles holding above the 1,500 – 2,200 area can be one of the driving factors.
3.Moo Deng (MOODENG)

The Moo Deng (MOODENG) trend change experienced quite heavy pressure after the trend changed to a negative direction, the failure of the Candle to stay above the WMA/85 was one of the factors supported by the 2,300 – 2,800 area being the dominant strengthening area.
4.Jupiter (JUP)

The weakening will test the strength of the 5,000 – 7,500 Support. If this price is broken, Jupiter (JUP) will touch its lowest price and the Bearish phase will increasingly dominate the changes.
5.Worldcoin (WLD)

The lack of strengthening has caused Worldcoin (WLD) to stagnate in a negative direction, with the possibility of Worldcoin (WLD) testing the support range of 8,000-12,000.
NOTE: If the 5 EMA crosses the WMA 75, 85 and 200 EMA lines and the lines intersect from the bottom up, then the market trend tends to go up (bullish), each table above shows that if the 5 EMA value is higher than the 75.85 WMA and 200 EMA, the market tends to go up (bullish).
If the RSI and MACD values ??show the same condition, it means that the market is showing the same trend. Overbought or oversold conditions are an indicator that the market is already at the point of changing direction of a trend.
ATTENTION: All contents which includes text, analysis, predictions, images in the form of graphics and charts, as well as news published on this website, is only used as trading information, and is not a recommendation or suggestion to take action in transacting either buying or selling. certain crypto assets. All crypto asset trading decisions are independent decisions by the users. Therefore, all risks arising from it, both profit and loss, are not the responsibility of Indodax.
 Market