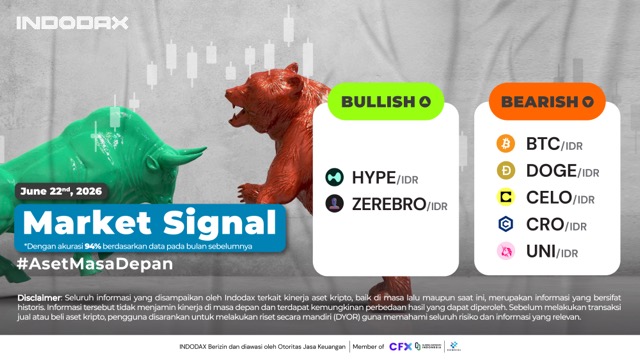
This week, the bullish crypto asset rankings were led by Hyperliquid (HYPE) in first place, followed by Zerebro (ZEREBRO).
Want to know the performance of your favorite crypto assets? Check the INDODAX Market Signal below
3 Bullish Crypto Assets
1. Hyperliquid (HYPE)
Currently, the price is weakening, causing the candle to break through the WMA/85. The trend will resume positive strengthening if Hyperliquid (HYPE) can penetrate the 1,350,000 – 1,500,000 area.
2.Zerebro (ZEREBRO)
Despite experiencing a correction, Zerebro (ZEREBRO) managed to stay above Support 360 – 400 so that the trend gave a positive response where Zerebro (ZEREBRO) managed to Rebound and penetrate the Resistance area 560 – 620.
5 Bearish Crypto Assets
1.Bitcoin (BTC)
Not driven by positive momentum, Bitcoin (BTC) prices have again corrected, not yet correcting the weakening trend that previously occurred after the resistance area of ??1,200,000,000 – 1,300,000,000 was not penetrated.
2.Dogecoin (DOGE)
Dogecoin (DOGE) has hit its lowest price since August 2024, signaling negative momentum for Dogecoin (DOGE). The RSI indicator has moved out of the overbought area, but the price of Dogecoin (DOGE) has not experienced significant gains.
3.Celo (CELO)
It is estimated that Celo (CELO) has a significant resistance at the price level of 1,800 – 2,600 candles. If it can be formed beyond this level, it will encourage the trend to correct the weakening that has occurred.
4.Cronos (CRO)
Limited movement but more inclined towards the weak direction, making Cronos (CRO) still in the Bearish phase, the Bollinger Bands indicator gives an indication if the price moves in a negative direction.
5.Uniswap (UNI)
The 1-day timeframe used indicates that Uniswap (UNI) has been in a bearish phase since November 1, 2025, having corrected by more than 45%, causing Uniswap (UNI) to reach its lowest price since 2024.
NOTE: If the 5 EMA crosses the WMA 75, 85 and 200 EMA lines and the lines intersect from the bottom up, then the market trend tends to go up (bullish), each table above shows that if the 5 EMA value is higher than the 75.85 WMA and 200 EMA, the market tends to go up (bullish).
If the RSI and MACD values ??show the same condition, it means that the market is showing the same trend. Overbought or oversold conditions are an indicator that the market is already at the point of changing direction of a trend.
ATTENTION: All contents which includes text, analysis, predictions, images in the form of graphics and charts, as well as news published on this website, is only used as trading information, and is not a recommendation or suggestion to take action in transacting either buying or selling. certain crypto assets. All crypto asset trading decisions are independent decisions by the users. Therefore, all risks arising from it, both profit and loss, are not the responsibility of Indodax.
 Polkadot 2.25%
 BNB 0.52%
 Solana 4.62%
 Ethereum 2.32%
 Cardano 1.02%
 Polygon Ecosystem Token 1.87%
 Tron 2.75%
 Market