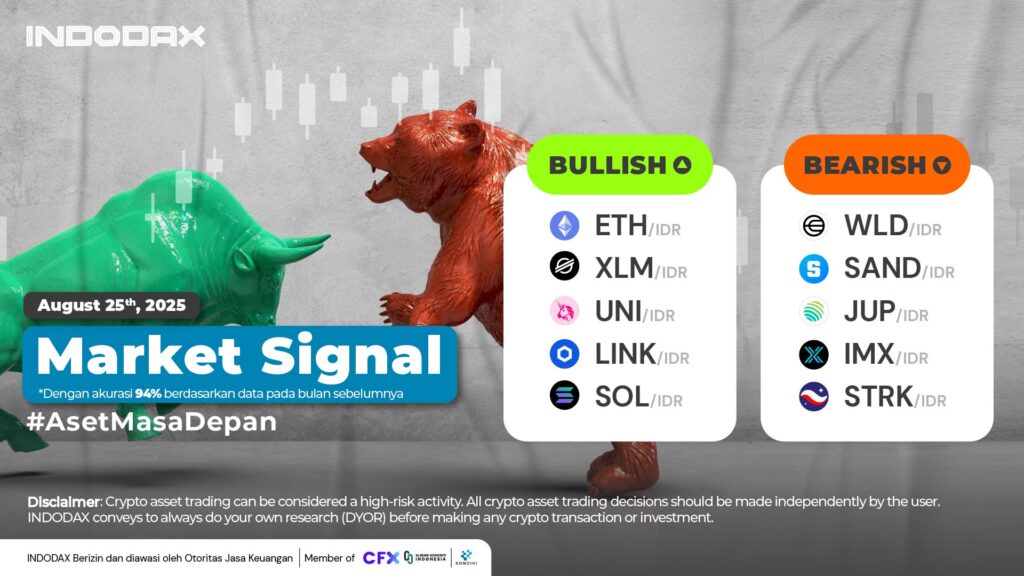
This week, the bullish crypto lineup is led by Ethereum(ETH) in first place, followed by Stellar (XLM) and Uniswap (UNI).
Want to know how your favorite crypto asset is performing? Check INDODAX Market Signal below!
5 Bullish Crypto Assets
1.Ethereum (ETH)

Ethereum (ETH) will move quite dynamically with the trend maintaining above the WMA/75 with the possibility of trying to reach the Resistance area of ??80,000,000 – 85,000,000.
2.Stellar (XLM)

Stellar (XLM) strengthening is projected to be realized with an increasing trend above the 7,000 – 8,500 area so that the Bullish trend will increasingly dominate subsequent price changes.
3.Uniswap (UNI)

A bullish trend is confirmed to occur on July 31, 2025. Uniswap (UNI) is expected to rally by more than 20%, in line with the prevailing trend. The rally will attempt to break through the 200,000-220,000 area.
4.Chainlink (LINK)

Chainlink (LINK) responded positively to the trend movement, failing to break through the EMA/200 causing the trend to rebound and confirming that Chainlink (LINK) remains in the Bullish zone.
5.Solana (SOL)

It is indicated that the Resistance area is quite strong in the range of 3,400,000 – 3,500,000 with the formation of a Candle above this area will provide a positive impetus for Solana (SOL) to strengthen.
5 Bearish Crypto Assets
1.Worldcoin (WLD)

Still moving below WMA/85 indicates that currently Worldcoin (WLD) is still unable to improve the weakening trend, Worldcoin (WLD) Resistance is in the range of 18,000 – 24,000 MACD indicator still shows Worldcoin (WLD) is in the Sideways phase.
2.The Sandbox (SAND)

The bearish trend is expected to turn bullish with the addition of a fairly wide resistance in the range of 5,000 – 9,000, so that the candle can possibly stay above the EMA/200.
3.Jupiter (JUP)

The current trend movement of Jupiter (JUP) is estimated by the MACD indicator to be in a Sideways Bearish phase, Jupiter (JUP) is moving in the range of 7,000 – 11,000.
4.Immutable (IMX)

Strengthening of Immutable (IMX) will have a negative impact on the ongoing Bearish trend, with the strengthening attempting to test the strength of the Resistance of 10,000 – 16,000.
5.Starknet (STRK)

There is no significant price fluctuation, causing the Starknet (STRK) trend to stagnate and remain in the Bearish Sideways phase.
NOTE: If the 5 EMA crosses the WMA 75, 85 and 200 EMA lines and the lines intersect from the bottom up, then the market trend tends to go up (bullish), each table above shows that if the 5 EMA value is higher than the 75.85 WMA and 200 EMA, the market tends to go up (bullish).
If the RSI and MACD values ??show the same condition, it means that the market is showing the same trend. Overbought or oversold conditions are an indicator that the market is already at the point of changing direction of a trend.
ATTENTION: All contents which includes text, analysis, predictions, images in the form of graphics and charts, as well as news published on this website, is only used as trading information, and is not a recommendation or suggestion to take action in transacting either buying or selling. certain crypto assets. All crypto asset trading decisions are independent decisions by the users. Therefore, all risks arising from it, both profit and loss, are not the responsibility of Indodax.
 Market