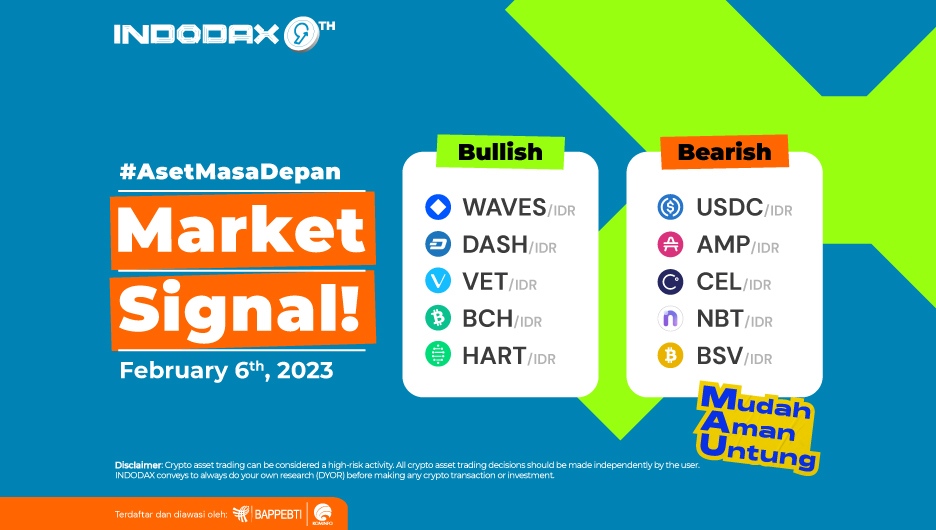
Hello Indodax members! At the beginning of this February, WAVES topped the bullish crypto asset position, followed by DASH and VET. Check out the full Indodax Market Signal!
5 Bullish Crypto Assets
Waves (WAVES)

The movement of WAVES at 4 hours looks quite positive after previously moving sideways, ensuring a dynamic strengthening after staying above the price of 28,000 and confirming a bullish phase.
The MACD indicator shows that if the trend is in a positive phase with a positive histogram, a strengthening of the chart will indicate a heading to the level of 48,500 – 56,500 if it is broken. The next resistance level is in the area of 63,000 – 72,000.
DASH (DASH)

DASH has been in the Uptrend zone since November 28, 2022, had experienced a correction that was able to suppress the trend, but this has not been confirmed as canceling the Bullish trend because prices were unable to penetrate the 620,000 – 650,000 area.
Strengthening will continue if the price can pass the resistance level in the 950,000 – 1,025,000.
VeChain (VET)

Passing the Resistance area 270 – 285 ensures that VET enters the Bullish trend. The price increase impacted VET, such as the break of several relatively strong resistance levels available in the 4-hour time frame, such as the 300 – 325 and 340 – 350 areas.
The current movement, if described by the MACD indicator, requires additional time to confirm the direction of the next price movement.
Bitcoin Cash (BCH)

The RSI indicator on Bitcoin Cash currently illustrates that the trend of price changes is still in a normal range because it has not touched the Overbought and Oversold areas.
Still, the support and resistance levels will determine the movement’s momentum, with the nearest Support level on BCH at 1,770,000 – 1,900,000 while the Resistance zone is at 2,120,000 – 2,400,000.
Hara Token (HART)

Ending the Sideways Bearish zone in the 25-30 price range by breaking the resistance area, followed by HART being able to move in line with WMA/75 so that it passed EMA/200, and on January 28, Hara Token was in a bullish trend.
The MACD indicator indicates that, currently, the trend is in the negative zone. If weakness occurs, it will test level 38. A break of this level will increase negative momentum for HART.
5 Bearish Crypto Assets
USD Coin (USDC)

Had moved Sideways in the range of 15,435 – 15,750, it was confirmed that the Support level could not decline, so the Bearish phase was unavoidable. USDC has weakened to around 5% since being in the Bearish phase.
The weakening of the USD Coin is likely to deepen if the trend doesn’t manage to stay above the support level of 14,630 – 14,780.
Amps (AMP)

The 4-hour chart indicates that Amp is currently in the Sideways Bearish phase with an estimated price movement range of 65 – 80. If you can break one of these levels, this will further confirm the direction of movement on the MACD indicator.
Celsius (CEL)

Based on the chart, CEL is still in the Bearish phase. The weakening will improve if the quite strong Resistance level at 9,900 – 12,420 can be passed, and creating a candle with a complete shape, will increase the opportunity to move towards the 14,000 – 15,600 area.
NanoBytes (NBT)

Even though the current trend is in the Bearish zone, the possibility of strengthening is wide open. If NanoByte can move above WMA/85, there is an indication to strengthen, and a break of EMA/200 can occur. Assuming EMA/200 is passed, it can move to areas 77-82.
Bitcoin SV (BSV)

The decline in the trend since Bitcoin SV was in the Downtrend phase is quite deep. The current price movement is indicated to be moving in the Sideways phase in the price range of 550,000 – 750,000, which is in line with the Bollinger Bands and MACD indicators. A break of one of the price levels will create momentum for BSV.
NOTE: If the 5 EMA crosses the WMA 75, 85 and 200 EMA lines and the lines intersect from the bottom up, then the market trend tends to go up (bullish), each table above shows that if the 5 EMA value is higher than the 75.85 WMA and 200 EMA, the market tends to go up (bullish).
If the RSI and MACD values ??show the same condition, it means that the market is showing the same trend. Overbought or oversold conditions are an indicator that the market is already at the point of changing direction of a trend.
ATTENTION: All contents which includes text, analysis, predictions, images in the form of graphics and charts, as well as news published on this website, is only used as trading information, and is not a recommendation or suggestion to take action in transacting either buying or selling. certain crypto assets. All crypto asset trading decisions are independent decisions by the users. Therefore, all risks arising from it, both profit and loss, are not the responsibility of Indodax.


