Support resistance is one of the concepts in crypto trading. This is an attribute that is discussed quite often in technical analysis.
This term indicates price levels on charts/graphs, markers of price movements that do not penetrate a specific value.
See the following review to learn more about support and resistance and how to recognize them.
What is Support?
Support is when demand is strong enough to stop the asset from falling further.
Support is an area where the price could not break and could turn up, which is located below the current price. Support usually responds with Buy/Buy action.
What is Resistance?
Resistance is when the supply is strong enough to stop the asset from increasing.
Resistance is an area where the price cannot penetrate and can reverse down, which is located above the current price and is usually responded to by selling/selling.
What are the Characteristics of Support and Resistance?
The following are the characteristics of resistance and support:
- When the price of an asset breaks resistance, it has the potential to become support.
- The more often the chart/asset price approaches the support/resistance level without being passed/broken, that is what is known as support and resistance. The level is getting stronger.
- When a support or resistance level is successfully broken, the strength of the break depends on how long the support or resistance level lasts.
How to Determine Support and Resistance?

Below are several ways to determine support and resistance:
1. Using Fibonacci
The first way is using Fibonacci Extension or Fibonacci Retracement, a tool for performing technical analysis using numbers.
In Fibonacci Retracement, several point numbers are commonly used to determine support and resistance.
This number can be written as a percentage or in ordinary numbers, namely 0.236 or 23.6%, 0.382 or 38.2%, 0.618 or 61.8%, 0.764 or 76.4%, and 1 or 100%.
Usually, this number is followed by a Fibonacci Extension which is commonly used as a target for taking profits.
The most common Fibonacci Extension numbers are 1,000 or 100%, 1,618 or 161.8%, 2,618 or 261.8%, 3,618 or 361.8%, and 4,236 or 423.6%.
As an example of its use, in a downward movement, Fibonacci Retracement can be drawn by drawing a line from the highest price to the lowest price of the trend or price movement.
Meanwhile, for upward movements, traders can do the opposite. Not all traders use this method because two sides of traders do the opposite.
For example, in the downward movement, the Fibonacci Retracement is formed by drawing a line from the lowest to the highest. On an uptrend, traders will do the opposite.
It needs to be underlined traders or analysts will use the numbers on Fibonacci earlier as support and resistance, according to price movements at that time.
2. Using Indicators
Second, you can use indicators, for example, Moving Averages, to determine support and resistance.
Indicators are lines formed according to mathematical or statistical calculations based on previous price movements.
Typically, indicators are used as a tool to predict future price movements.
In this case, the Moving Average is one of the most frequently used indicators. The reason is this indicator is most commonly used to see price movements.
Typically, indicators are used as tools when carrying out technical analysis, especially when determining support and resistance.
This is because the price limit will not be seen clearly if you only use one indicator.
3. Drawing Manual
The third way is to draw support and resistance manually using the drawing tools available at Tradingview.
When drawing manually to determine support and resistance, ensure that prices frequently visit the boundary area.
If the price frequently visits that boundary, moves in the opposite direction, or there is resistance, there is a high probability that this area is an area of support or resistance.
This limit is usually filled with many candlestick wicks and supplied by closing the candlestick body.
When drawing manually, two ways can be used: using trend lines or lines and seeing which areas are often touched by candlesticks.
Example of Resistance Becomes Support
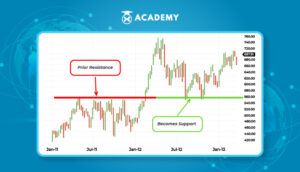
It should be understood that the key concept of technical analysis is that when a resistance or support level is broken, the roles will be reversed.
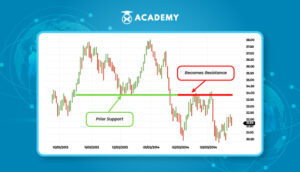
In this case, if the price drops below the support level, that level will become resistant.
Here’s an example:
Example of Support Becomes Resistance
Meanwhile, if the price rises above the resistance level, it will usually become support.
When a price moves past a support or resistance level, supply and demand are thought to have shifted, making the broken level reverse its role.
Here’s an example:

After understanding how to determine support and resistance, you can now monitor crypto price movements on this market page.
Thus a review of support resistance is essential to know.
Also, check out articles about crypto assets, blockchain, and more only at Indodax Academy.


