If you have ever noticed a price chart that shows a V-like pattern followed by a U-like shape, then it is most likely the Adam Eve Pattern.
This technical pattern often appears before a price reversal, either towards an uptrend or a downtrend.
Although rarely the main focus in technical analysis, this pattern can provide a fairly convincing signal if identified correctly.
But, what exactly is the Adam Eve Pattern? Why do many experienced traders use it as a reference in detecting reversal signals?
And how do you understand this pattern so that you don’t miss out on profit opportunities when the trend starts to reverse? Let’s see the explanation in the review below!
What is the Adam Eve Pattern?

The Adam Eve Pattern is included in the category of patterns used to identify potential trend reversals in market price movements.
This pattern can appear both when the trend is up or down, and is known to have a distinctive visual form.
It is called rare because it does not appear as often as other technical patterns, but when it is formed, the resulting signal tends to be strong and accurate.
In general, this pattern consists of two main components, namely Adam and Eve. The Adam part is marked by a sharp and steep price decline, creating a shape resembling the letter V.
The typical characteristics of the Adam pattern are narrow and sharp curves, often only lasting a short time.
This decline is then followed by a fairly rapid price rebound, indicating the potential for buying pressure to enter the market.
After the Adam phase is complete, the second part appears, namely Eve, which has a rounder and wider shape, resembling the letter U.
In this phase, the price moves down slowly, then turns up with a smoother curve and a longer duration than the previous phase.
This U pattern indicates a more stable and controlled market movement, before finally returning to touch the important resistance or support area that was previously formed during the Adam phase.
There are two main variations of this pattern, namely Adam-Eve Bottom and Adam-Eve Top, with the following explanations:
Adam-Eve Bottom is a reversal pattern from a downtrend to an uptrend (bullish reversal). This is a strong signal for traders to consider buying, especially if the price manages to break through the resistance area after the Eve phase is complete.
Adam-Eve Top, on the other hand, is a bearish reversal signal, or a reversal from an uptrend to a downtrend, which can be an opportunity to sell or take profit.
Although at first glance this pattern is similar to Double Bottom or Double Top, the difference lies in the shape and time of formation.
Adam tends to occur faster and sharper, while Eve occurs slower and forms a smooth curve. This is what distinguishes it from other classic double patterns.
This pattern was first introduced by Thomas Bulkowski in his book entitled Encyclopedia of Chart Patterns.
He noted that the Adam Eve Pattern has a fairly high success rate, especially if confirmed by increasing transaction volume.
Therefore, although this pattern is relatively rare, many professional traders rely on it as one of the technical weapons that can be relied on to detect potential price reversal moments.
Also read related articles: How to Read Double Bottom Patterns in Investment
The Psychology Behind the Adam & Eve Pattern
The Adam & Eve pattern not only reflects a visual formation on the price chart, but also represents the psychological dynamics of market participants behind the movement.
Each part of the pattern signals a change in the collective emotions and behavior of traders and investors involved in the transaction.
The Adam phase occurs when the market is under extreme pressure, both from the selling and buying sides. At this stage, price movements are very sharp, creating a V-shaped formation that reflects a spontaneous and emotional response.
Trading volume usually increases drastically because many market participants react to certain news or sentiments quickly and aggressively.
As a result, prices quickly reach extreme points, whether it is a bottom in a downtrend or a top in an uptrend.
In contrast, the Eve phase reflects a change in market mood to a calmer one. After the sharp volatility in the Adam phase subsides, buying or selling pressure begins to decrease.
Prices no longer move aggressively, but instead enter a longer consolidation phase. This is when market participants begin to hesitate and reconsider the direction of the next movement.
Trading volume tends to be more stable, and the chart forms a more sloping and rounded pattern, resembling the letter U.
The combination of emotional impulses in the Adam phase and the consideration period in the Eve phase indicates that the market is at a transition point.
When the price finally breaks through the resistance or support level after the Eve phase is complete, it is a strong signal that the majority of market players have agreed to move in a new direction.
This is where the trend reversal occurs, either up or down, and traders who are sensitive to this pattern can use it as a potential entry opportunity.
You may also be interested in this: Understanding Bullish Engulfing and How to Use It
How to Recognize the Adam Eve Pattern
To be able to utilize the trend reversal signal from the Adam Eve pattern effectively, you need to understand how to recognize it thoroughly.
Although this pattern is similar to a double top or double bottom at first glance, its structure and characteristics have important differences that must be considered.
The following are the steps you can follow to identify this pattern correctly, including:
1. Use a 4-hour (4H) or daily timeframe
The Adam Eve pattern is easier to recognize on a 4H or Daily timeframe because short-term price movements are not too disruptive so that the V and U shapes look clearer and more accurate.
2. Activate the volume indicator on the price chart
Volume is an important element in validating this pattern. In the Adam phase, there will usually be a spike in volume due to very aggressive buying or selling pressure.
Conversely, when the Eve phase takes place, the volume begins to stabilize or decrease, indicating that the market is entering a consolidation phase.
3. Pay attention to price formations: look for a combination of V and U shapes
This pattern is formed from two very distinctive parts, namely:
- Adam is characterized by a very sharp price drop (or increase) in a short time, forming a steep angle resembling the letter V.
- Eve appears afterward, with a gentler price movement, forming a curve resembling the letter U that is wide and slower to form than Adam.
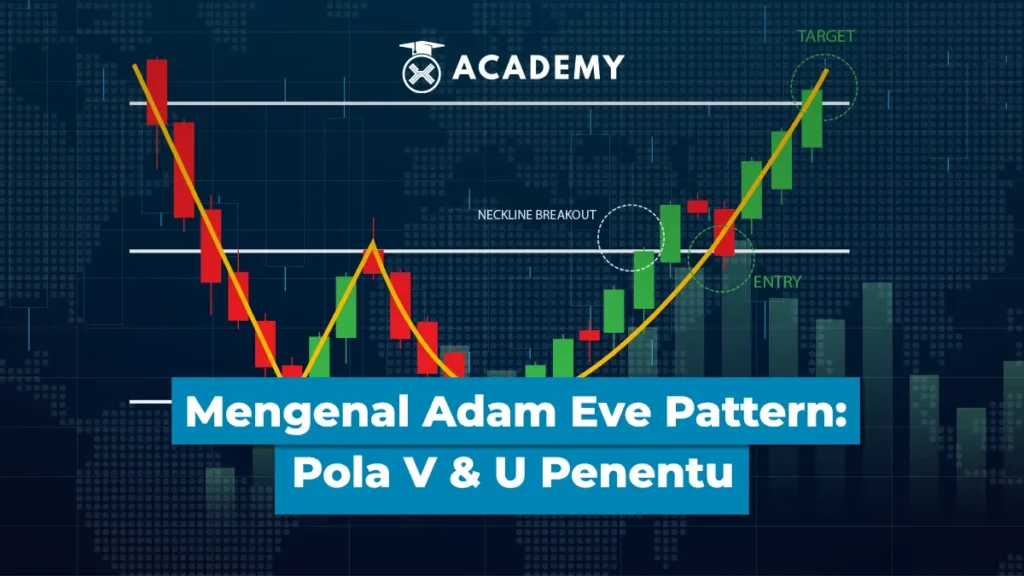
4. Draw a horizontal line at the resistance or support level (neckline)
After both formations are formed, identify the highest point (for the bottom pattern) or the lowest point (for the top pattern) between the two peaks or valleys.
Draw a horizontal line as the neckline. This line serves as an important boundary that must be penetrated for the pattern to be confirmed.
5. Wait for a valid breakout above or below the neckline
A breakout is the key to confirming this pattern. If the price breaks through the neckline with high volume, it is a strong signal of a trend reversal and an attractive entry opportunity.
Basically, there are many other patterns that visually resemble Adam Eve, such as the usual double top/bottom or rounding bottom.
However, these patterns are not necessarily valid if they are not supported by the appropriate volume and formation time characteristics.
Make sure you don’t just look at the shape, but also pay attention to the duration and behavior of the accompanying volume.
Another interesting article for you: Exit Trading Strategy: Exit the Market with Maximum Profit
Trading Strategy with Adam Eve Pattern
Once the Adam-Eve pattern has been successfully recognized and formed completely on the chart, you can start implementing a trading strategy based on this technical structure.
This strategy includes three main components, namely the entry point, the loss limit (stop loss), and the profit target (take profit). Here is a complete explanation:
1. Entry (Entry Point)
The ideal entry point occurs when the price successfully breaks through the neckline of the pattern. This breakout must be confirmed by a valid candle closing above the neckline (for bullish patterns) or below the neckline (for bearish patterns).
This confirmation is important to avoid false signals (false breakouts) that can trap traders.
2. Stop Loss (Loss Limit)
Placing a stop loss is very important for managing risk.. For bullish patterns, place the stop loss below the Eve section (which is usually flatter or wider than Adam).
Conversely, for bearish patterns, place the stop loss above Eve’s highest level. This strategy gives the price a fair amount of room to move, but keeps losses from getting bigger.
3. Take Profit (Profit Target)
To determine the profit target, measure the vertical distance from the base of the pattern to the neckline. Then, project this distance towards the breakout.
This Take Profit method helps estimate how far the price has the potential to move after successfully breaking through the neckline.
Additional Tips for Signal Validation
- Use RSI (Relative Strength Index)
The RSI indicator can be used to check whether the market is in an overbought or oversold condition. With this combination, you can get a stronger signal when the price is ready to reverse direction.
- Pay Attention to Volume During Breakout
Significantly increasing volume during a breakout is a sign that the price movement is supported by strong market participation. This can strengthen the validity of the pattern and reduce the risk of false breakouts.
Still on this topic, also see: 8 Beginner Mistakes in Crypto Trading That Must Be Avoided
Common Mistakes of Beginner Traders

Although the Adam-Eve pattern is quite popular and effective as an analysis tool, many novice traders still often make mistakes that can trigger wrong trading decisions. Here are some common mistakes to avoid, namely:
1. Entry Too Soon before the Pattern is Complete
Many traders are impatient and immediately enter a position when they see the first signs of a pattern forming. In fact, the Eve formation, which is usually flatter or wider than Adam, takes time to complete its shape completely.
Entrying too early can cause traders to enter when the price is not ready to breakout, thus risking a correction.
2. Impatient Waiting for a Valid Breakout
A valid breakout is the key to the success of this pattern. Unfortunately, some traders immediately take a position before there is confirmation of a candle close above or below the neckline.
As a result, they often get caught in a fakeout or false breakout, where the price only breaks through the neckline briefly and then reverses direction.
3. Misidentifying the Pattern
The Adam-Eve pattern has a distinctive feature, namely Adam is in the form of a sharp peak or base, while Eve is more sloping and wider.
Many traders are not careful and then confuse this pattern with other formations such as regular double top/bottom, cup and handle, or other consolidation patterns that look visually similar.
4. Ignoring Volume as a Validation Indicator
Volume is often overlooked by beginners, even though it is an important element in pattern validation. Strong breakouts are usually accompanied by a significant spike in volume.
If the volume remains low when the price breaks through the neckline, there is a possibility that the breakout is not solid or even fails.
Conclusion
Well, that was an interesting discussion about Getting to Know the Adam Eve Pattern: The Trend-Determining V & U Pattern that you can read in full at the Crypto Academy at INDODAX Academy.
In conclusion, although the Adam-Eve pattern is not as popular as Head & Shoulders or Double Top, that is precisely its advantage, namely because it is rarely glanced at, the opportunities are often cleaner or clearer.
This pattern can be a strong reversal signal if read correctly. The key lies in understanding the pattern shape, formation duration, movement volume, and breakout confirmation.
If you have mastered it, the opportunity to catch profit from the market reversal will be even greater.
Oh yes, in addition to expanding your knowledge of technical indicators, you can also stay updated with the latest crypto news and directly monitor the price movements of digital assets on the INDODAX Market. Don’t forget to activate notifications so that you always get the latest information about digital assets and blockchain technology only at INDODAX Academy.
You can also follow our latest news via Google News for faster and more reliable access to information. For an easy and safe trading experience, download the best crypto app from INDODAX on the App Store or Google Play Store.
Also maximize your crypto assets with the INDODAX Earn feature, a practical way to earn passive income from the assets you store.

Also follow our social media here: Instagram, X, Youtube & Telegram
FAQ
1.What is Adam Eve Pattern?
A V and U-shaped technical chart pattern that signals a trend reversal, either bullish or bearish.
2.What markets is this pattern suitable for?
Suitable for all liquid markets: crypto, forex, stocks—as long as there is volume and volatility.
3.Best timeframe to see Adam Eve Pattern?
4H or daily (1D) so that the formation is clearer and more valid.
4.What indicators can help validate this pattern?
Use volume, RSI, and moving averages as signal confirmation.
5.Can this pattern be used for scalping?
Less suitable for fast scalping, more effective for swing trades or intraday positions.
Author: Boy
 Market