In crypto asset trading, technical analysis is one of the most important tools for traders to make good investment decisions. This analysis includes studying historical price and trading volume data to identify patterns that can help predict future price movements. One pattern that traders often look for is the Bullish Flag pattern.
The Bullish Flag pattern is a bullish trend continuation pattern that occurs after a period of significant price increases. This pattern forms when the price of an asset experiences a sharp increase (flag pole), followed by a period of consolidation or slowdown (flag). This flag is usually seen as a steady decline in price with a triangle or parallelogram shape. After a period of consolidation, prices tend to resume their uptrend.
In trading crypto assets, technical analysis is very important for several reasons, including identifying trading opportunities, risk management, understanding market sentiment, and helping in choosing the right asset.
So, to understand more about what a Bullish Flag is, why this pattern is important, get to know its characteristics, types of Flag Patterns, how to read Bullish Flag Pattern signals, and strategies for trading with the Bullish Flag Pattern for beginners. Check out the full review below.
What is A Bullish Flag?

The Bullish Flag pattern is a price consolidation pattern that shows the continuation of the bullish trend of an asset’s price movement. Therefore, this pattern is included in the continuation pattern category. This pattern is formed when an asset experiences an uptrend but then experiences a decrease in buying pressure by market players, causing the asset to take a break from its upward trend.
During this consolidation period, the asset price alternately rises until it finally breaks into an even stronger bullish trend. For traders, this pattern indicates that the uptrend will continue over a longer period with very high strength. So, it is unsurprising that they feel very optimistic when this pattern appears in the asset price chart.
Why is the Bullish Flag Pattern Important?
The Bullish Flag pattern is important in technical analysis because it provides positive signals to help traders make smart investment decisions. One of them is that this pattern is a sign that despite a correction or temporary consolidation in an uptrend, the power of buyers (bulls) still dominates the market. In addition, when this pattern appears on the chart, it will indicate that traders and investors have high confidence in the asset. This pattern reflects the market’s belief that prices will continue to rise after consolidation.
Bullish Flag also provides guidelines for traders to measure potential price movements after a pattern breakout. The length of the flagpole (the difference between the lowest and highest price during the period) can estimate how far the price may rise after a breakout. By understanding the length of the pole, traders can set more realistic price targets.
Get to Know the Characteristics of A Bullish Flag
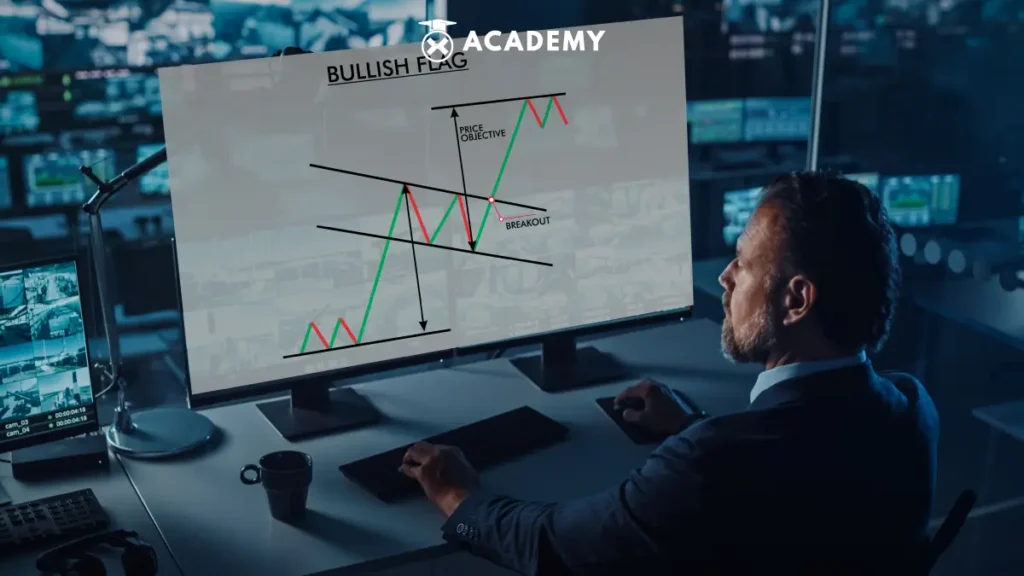
The Bullish Flag pattern has a striking structure when viewed from a visual perspective. This pattern consists of three main components, starting from the flagpole, the flag, to the breakout level. The following is an explanation of each characteristic, namely:
1. Flagpole
The pole or flagpole in the Bullish Flag pattern is formed due to strong buying action in the market and causes asset prices to increase sharply. This steep price increase resembles a flagpole. This condition should be an initial signal that the Bullish Flag pattern will soon form.
2. Flag
However, this buying action is slowly starting to subside because some market players are beginning to make a profit. Even so, bulls are still actively buying. As a result, asset prices fluctuate and often form lower highs and lower lows. A descending trend line can be drawn by connecting the lower high points.
Additionally, trend lines can be drawn by connecting the lower low points on the price chart. The lower high trend line is referred to as the upper trendline, while the lower low trend line is referred to as the lower trendline. If these two trend lines move symmetrically during the consolidation period, it can be said that a Bullish Flag pattern is forming.
Flag patterns generally consist of at least four up-and-down price movements that form new highs and lows. The trend line between lower highs can be used as a resistance level, while the trend line between lower lows can be used as a support level. The selection of these two areas makes sense because asset prices tend not to exceed lower high and lower low points during consolidation periods. During a consolidation period, asset prices form peaks and valleys several times within a limited range. The flag’s width should not exceed 50% of its Fibonacci retracement level.
3. Breakout Level
The breakout phase begins when the price rises and breaks through the last high (swing high). Typically, the length of the price movement after this level is at least comparable to the length of the flagpole. This signals the beginning of a stronger continuation of the uptrend.
Types of Flag Patterns
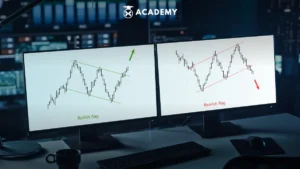
For your information, the Flag Pattern pattern is divided into two types: the bullish flag pattern, which indicates an upward price trend, and the bearish flag pattern, which means a downward price trend in the market. Although both have similar structures, the main difference lies in the trend direction and transaction volume patterns. The following is an explanation regarding the two types of Flag Pattern patterns, namely:
1. Bullish Flag Pattern
A bullish (bull) flag pattern is a pattern that indicates that prices will increase. This pattern indicates greater buying pressure than selling pressure, pushing prices up and signaling that momentum will continue in an uptrend.
Flags can be horizontally rectangular but often tilt downwards about the current trend. There is another variant called the bullish pennant, where the consolidation process forms a symmetrical triangle.
2. Bearish Flag Pattern
A bearish (bear) flag pattern is a pattern that indicates a downward price trend in the market. When the price is in a downward trend, the bearish flag pattern indicates a slow consolidation after a period of aggressive decline. This pattern indicates greater selling pressure than buying pressure, pushing the price downwards and telling that momentum will continue downward.
How to Read the Bullish Flag Pattern Signal?
Because this pattern shows strong bullish strength and is easy to recognize, it is not surprising that traders like it. However, it is still important for traders to confirm this pattern to avoid getting caught in false signals. The following are confirmation steps to identify a valid Bullish Flag Pattern, including:
1. Key Confirmation Point after Breakout
The confirmation point in the Bullish Flag pattern occurs after the breakout phase. Why? As previously mentioned, the resistance area in this pattern is drawn from the upper trendline. Therefore, if the asset price penetrates the upper trendline, the asset price has successfully penetrated the resistance level.
In this case, traders can assume that the breakout has occurred maturely. Traders with a moderate level of risk usually wait for the candlestick after the breakout as confirmation that the bullish trend will continue.
2. Fibonacci Retracement
The consolidation phase that forms a flag pattern on a candlestick chart must have a narrow range. The smaller the range between the highest and lowest levels, the more valid the pattern.
Traders can measure this using Fibonacci retracement, ensuring the range does not exceed 50%. Some trading experts argue that an authentic flag pattern is within the 38% Fibonacci retracement range.
3. Volume during Bullish Flag Formation
A significant increase generally follows bullish patterns in trading volume. The same applies to the Bullish Flag pattern, where increasing volume plays an important role in the price rally when the pole is formed and during the breakout phase. However, volume tends to decrease during consolidation phases. This decrease in volume will affect the range and width of the flag.
4. Trend Strength
Even though the consolidation period looks flat (sideways), the trend’s strength greatly influences the confirmation of the flag pattern. The stronger the trend driving the rally when the pole is formed, the greater the chances of continuing the rally once the pattern is confirmed.
Examples of Bullish Flag Pattern
:format(webp)/cloudfront-us-east-1.images.arcpublishing.com/coindesk/UVUYDB2XLRGDZLNM2J3B6ABMH4.png)
Image Source: coindesk.com
One example of a Bullish Flag Pattern in the context of crypto assets occurred in Bitcoin price movements on February 20, 2017. In this case, the chart shows the formation of a flag pole pattern, which indicates the continuation of the upward trend in Bitcoin prices. This pattern started from a low of around $917 and continued its journey towards $1,228. The chart shows a Bullish Flag pattern, which reflects market optimism regarding the potential for Bitcoin price increases.
Strategy on How to Trade with the Bullish Flag Pattern for Beginners
Trading with the Bullish Flag pattern is quite simple. Generally, this pattern provides a buy signal because it indicates that the asset price will experience a continued rally. However, it is important to remember that this strategy is only a general tip and guide in using the Bullish Flag Pattern. Investing in crypto assets has high risks, and the results cannot be predicted with certainty.
The following is a strategy for trading with the Bullish Flag Pattern for beginners that you need to know, including:
1. Entry
The best entry point is usually at the top of the tail of the last candlestick of the flag phase. However, this position is riskier because the breakout may not be successful. Therefore, if a trader has a lower level of risk, then he can wait until the confirmation candle appears after the breakout before entering a position. Although this action may reduce the profit potential compared to entering before the breakout, it is better to have certainty than to get caught in false signals.
2. Stop Loss
Traders can set Stop Loss at the nearest swing low point to anticipate potential rally failure. As an alternative, some traders also suggest placing a Stop Loss if the price fails to break through the last reversal level. This aims to protect trader capital in unwanted situations.
3. Target Profit
Traders can refer to the height of the flagpole to estimate how far the rally will continue after the breakout. By calculating this, traders can determine more realistic profit targets. This will help traders to have clearer expectations about the potential profits they can achieve from this trade.
Conclusion
In conclusion, when making investment decisions, it is very important for a trader not to rely on just one indicator or pattern. The crypto asset market is dynamic and complex, so using various analytical tools and accurate information is necessary.
In this regard, a deep understanding of the Bullish Flag pattern in technical analysis is very important in trading crypto assets. The reason is that this pattern shows the potential for a continuation of the uptrend and can provide useful signals for traders. However, it is also important to remember that there is no guarantee of success in trading because risks are always there.
With a good understanding of the Bullish Flag pattern, traders can improve their skills in identifying potential trading opportunities. However, traders need to complement their knowledge with in-depth analysis, good risk management, and investment decisions based on careful data and research to achieve long-term success. You can read a collection of articles at INDODAX Academy.
Invest in Crypto on INDODAX
So, now you understand what a Bullish Flag is, why this pattern is important, its characteristics, types of Flag Patterns, how to read Bullish Flag Pattern signals, examples of Bullish Flag Patterns, and strategies for trading with the Bullish Flag Pattern for beginners.
Next, if you are interested in investing in crypto, it would be a good idea to check the crypto market at INDODAX market first. After reviewing the price, you can buy crypto assets on a trusted crypto exchange only on INDODAX.
It is important to know that INDODAX is a well-known and first crypto asset buying and selling platform in Indonesia that provides trusted services for investors. At INDODAX, you can easily access the crypto asset market to carry out guaranteed secure transactions.
So what are you waiting for? Let’s start investing in crypto assets with INDODAX right now!
 Market

