In understanding price fluctuations in the world of trading, one approach commonly used is technical analysis. Many technical analysis methods can be used to understand stock price movement patterns, including the Elliott Wave analysis.
Elliott Wave analysis is a technical method to understand price movement patterns in stocks and other financial markets, including crypto. This theory is based on the assumption that the market follows a regular and predictable wave pattern.
So, to understand what Elliot Wave is, how Elliott Wave Theory works, its advantages and disadvantages, the secret of how to use it for trading, and its relationship with Fibonacci. Check out the full review below!
What is Elliott Wave Theory?

Elliott Wave Theory is a method in technical analysis that predicts asset price trends. This is done by paying attention to the wave pattern of asset prices briefly before the movement occurs.
This wave pattern is divided into two types, namely impulse waves and corrective waves. Impulsive waves reflect price movements in a certain direction within a certain period. These waves reflect an imbalance in market sentiment that directs prices in one direction. If the trend line is rising, this indicates euphoria in the market, while a downward trend reflects traders’ panic, which drives prices further down.
Meanwhile, a corrective wave occurs when the price reaches a balance point after experiencing an imbalance during an impulsive wave. The speed of price movement plays a key role in corrective waves. The faster the price rises, the more likely the price will fall as a correction. On the other hand, if the price falls very quickly, the possibility of an upward correction becomes greater. Although the Elliott wave theory was originally developed for the stock market, the Elliott wave concept can be applied to many types of markets, including crypto asset markets.
Quoting from the website investopedia.com, historically, this theory was discovered by Ralph Nelson Elliot, an American accountant and writer, in 1930. After being published for five years, Elliott Wave was proven to be accurate in predicting declines in stock prices. Since then, this theory has become popular in the world of trading. Elliott Wave assumes that asset price movements are influenced by psychology and market sentiment. Elliot found that these two factors form a price pattern similar to a wave. This pattern tends to repeat itself over time. Elliot thinks share prices can be predicted based on past wave patterns.
Get to Know the Five Waves Pattern (Motive and Corrective)
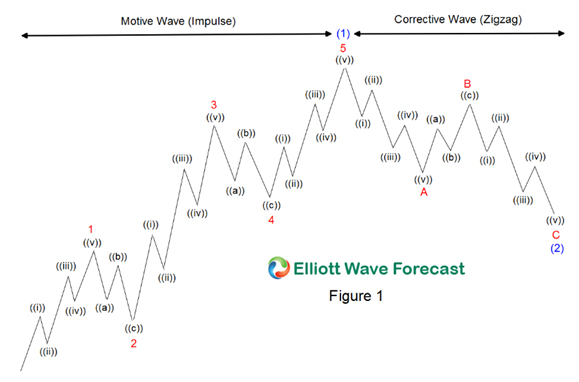
Image Source: elliottwave-forecast.com
Elliott’s model predicts impulsive and corrective phases in market prices on various time scales. The impulsive phase is always divided into five waves of low degree, alternating between motive and corrective character. Therefore, waves 1, 3, and 5 are considered impulses. Meanwhile, waves 2 and 4 are smaller retraces than waves 1 and 3.
In the example of Figure 1, waves 1, 3, and 5 are motive waves consisting of 5 smaller degree impulses, labeled ((i)), ((ii)), ((iii)), ((iv)), and ((v)). Meanwhile, waves 2 and 4 are corrective waves, which are divided into three waves of smaller degrees, denoted as ((a)), ((b)), and ((c)). These five waves form a motive wave of a greater degree (1), while the corrective wave consists of 3 waves of a smaller degree, denoted as ABC (2). In a bear market, the dominant trend is downward, so the pattern is reversed with five down waves followed by three up waves.
How Does Elliott Waves Work?
Several technical analysts try to optimize trading on the stock market using Elliott Waves. This theory states that stock price movements can be anticipated because they follow a recurring pattern of ups and downs. These are called waves, which are triggered by investor psychology and sentiment.
In this theory, two types of waves are identified, namely, motive waves (also known as impulse waves) and corrective waves. However, it is important to remember that interpretation of this theory is subjective. Traders have varying opinions on the effectiveness of this strategy.
Unlike many other price formations, wave analysis cannot be equated with conventional step-by-step guides. Wave analysis provides a deeper understanding of trend dynamics and helps traders understand price movements more comprehensively.
What Are the Advantages and Disadvantages of Elliot Waves?

An explanation of the advantages of using Elliott Waves, from their ease of use to their ability to identify price reversals.
As a trader, it is important to understand the advantages and disadvantages of the Elliott Wave before deciding to use it in trading. This allows traders to make smarter and more informed decisions in their trading activities.
The following are several advantages and disadvantages of Elliot Waves, including:
1. Advantages
- Identifying price movement patterns: Elliott Wave helps traders recognize price movement patterns on charts and find points of trend reversal or continuation.
- Provides an overview of trend direction: By recognizing wave patterns, the Elliott Wave provides insight into the trend direction of price movements. This allows traders to make more informed trading decisions.
- Use of Fibonacci levels: Elliott Wave uses Fibonacci retracement and extension levels, which traders widely use to analyze price movements. This helps traders establish important support and resistance levels.
- Applicable to various timeframes: Elliott Wave can be applied to multiple timeframes, ranging from short to long-term. This provides a bird’s eye view of the trend direction.
- Subjective and flexible: Elliott Wave requires subjective interpretation and can be adapted to the trader’s needs. Traders can combine it with other technical analyses, such as indicators and price action.
2. Disadvantages
- Subjective: The interpretation of wave patterns in an Elliott Wave is subjective and can differ between traders, resulting in varying results.
- Complex: Elliott Wave is a complex technical analysis theory that requires much time and effort to understand properly.
- Sensitive to noise: Like other technical analyses, the Elliott Wave can also be affected by unexpected price movements, resulting in disturbed wave patterns.
- Not always accurate: Although they provide an idea of ??trend direction, Elliott Waves is not always accurate. Wave patterns can be complex and difficult to interpret, resulting in errors in price predictions.
- Not suitable for all traders: Elliott Wave requires experience and expertise in analyzing prices, so it is not ideal for beginner traders or those with less experience in technical analysis.
Uncovering the Secrets of How to Use Elliott Waves for Trading
An explanation of the secret of how to use it where eight main waves are formed and repeated continuously. The trend has five waves: 1-2-3-4-5, and three correction waves ABC.
In Elliott’s wave theory, as quoted from gicindonesia.com, eight basic waves continuously repeat themselves. These eight waves include five waves in the main trend, namely waves 1-2-3-4-5, as well as three correction waves that are in the opposite direction to the main trend, namely waves ABC. Ralph Elliott calls it the 5-3 wave pattern. Each wave movement can be subdivided into smaller subsections with the same 5-3 wave pattern.
Then, each sub-section can be decomposed into smaller sub-sections with identical wave patterns. Fractals in Elliott Wave theory are self-similar wave patterns.
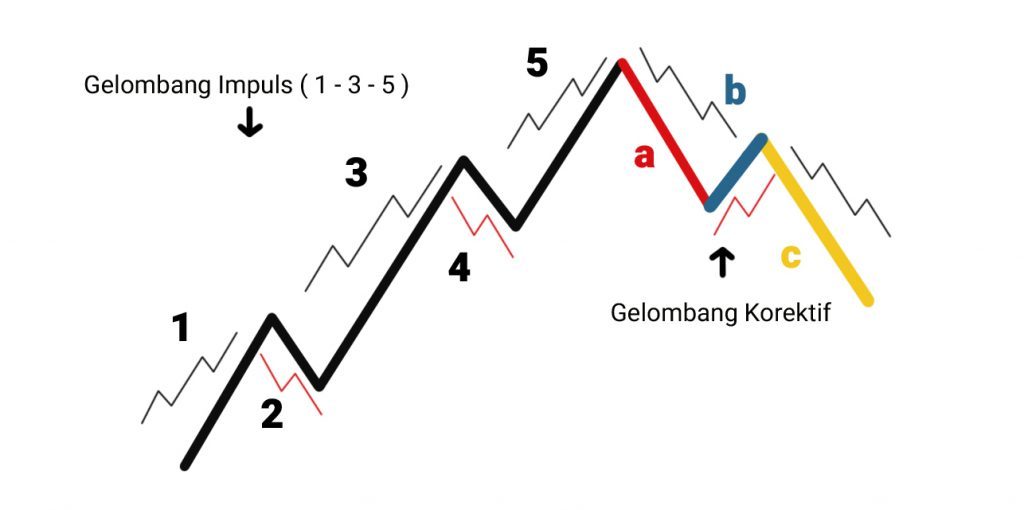
Image source: gicindonesia.com
Based on fractal fractions, Elliott grouped the wave scales from largest to smallest. The scale starts from grand supercycle, supercycle, cycle, primary, intermediate, minor, minute, minuette, and sub-minuette.
As previously explained, a five-wave movement in the direction of the trend is called an impulsive wave. In this pattern, the 3rd and 5th waves follow the direction of the main trend, while the 2nd and 4th waves are corrections to the impulsive wave. However, it is important to remember that corrections on impulsive waves differ from corrective ABC waves.
Please note, in Elliott Wave theory, three rules must be followed strictly so that the analysis is accurate. The following are the three rules, namely:
- Impulse wave number 3 should not be shorter than waves number 1 and 5.
- The starting point of impulse wave number 2 cannot be lower (if the trend is up) or higher (if the trend is down) compared to the starting point of impulse wave number 1.
- Impulse wave number 4 should not reach the highest high (if the trend is up) or lowest low (if the trend is down) on impulse wave number 1.
Is There a Connection Between Elliott Waves Theory and Fibonacci?
When studying Elliott Waves theory as an analysis technique, we often encounter the relationship between Elliott Wave theory and Fibonacci. In “Nature’s Law,” Ralph Nelson Elliott links wave movements to the Fibonacci series.
Elliott wave traders use Fibonacci retracement to determine correction levels in waves 2, 4, A, and C. Apart from that, Fibonacci expansion is also used to determine wave expansion levels before corrections occur in waves 3 and 5.
Traders generally monitor all Fibonacci retracement and expansion levels because it is difficult to predict which retracement levels the market will respond to. This causes the price to move in line with the main trend or which expansion level the market will respond to initiate a correction phase. Traders can use technical indicators like the Relative Strength Index (RSI) and stochastic oscillator to confirm signals, along with paying attention to price action.
Final Conclusions and Recommendations
In conclusion, the Elliott Wave theory predicts price trends by analyzing wave patterns. This wave pattern is divided into two types, namely impulse waves and corrective waves.
Some of the advantages of this theory include identifying price movement patterns, providing an overview of trend direction, using Fibonacci levels, applying to various time frames, and being subjective and flexible. However, it is important to remember that Elliott Wave is not an automated trading system that provides definitive trading signals. In contrast, this method involves highly subjective interpretation and requires a fairly high level of experience to be used effectively.
Crypto investors are strongly advised to exercise caution, continually increase their knowledge, and closely observe risk management practices. Devising a good strategy, managing risk, and not relying completely on one analytical tool are the keys to success in crypto investing. With a thoughtful approach, crypto traders can reduce risks and increase their chances of success in crypto investing.
Come on, Trade Crypto Now on INDODAX!
So, now you understand what Elliot Wave is, how it works, and its relationship with Fibonacci in the INDODAX Academy article.
Next, if you are interested in investing in crypto, it would be a good idea for you first to check the crypto market on INDODAX Market. If you have checked the price, you can buy crypto assets on a trusted crypto exchange only on INDODAX. With a good reputation and various strict security features, INDODAX provides a safe and reliable platform for carrying out crypto asset transactions. Besides that, using INDODAX services will make it easier for you to manage your crypto investments comfortably and safely.
Let’s start investing in crypto immediately only on INDODAX!
 Market

