
Fibonacci retracement is a trading indicator that is quite popular among traders.
Both among traders and commodities, Fibonacci is one of the most frequently used indicators.
This analysis tool can provide information such as support or resistance levels not owned by other indicators.
So, for those who want to know more about Fibonacci retracement, its indicators, history, how it works, and its advantages and disadvantages, see the full review below.
What is Fibonacci Retracement?
Fibonacci retracements are a series of numbers called Fibonacci numbers.
Fibonacci retracement functions to show support and resistance levels in the price of an asset.
First introduced in Europe by a mathematician named Leonardo Bigollo Pisano or Fibonacci, this series of numbers formed a sequence that came to be known as the “Fibonacci Sequence.”
Each number is the sum of the previous two last numbers in that sequence.
The series of numbers follow a pattern starting from 0, 1, 1, 2, 3, 5, 8, 13, 21, 34, 55, 89, 144, and so on.
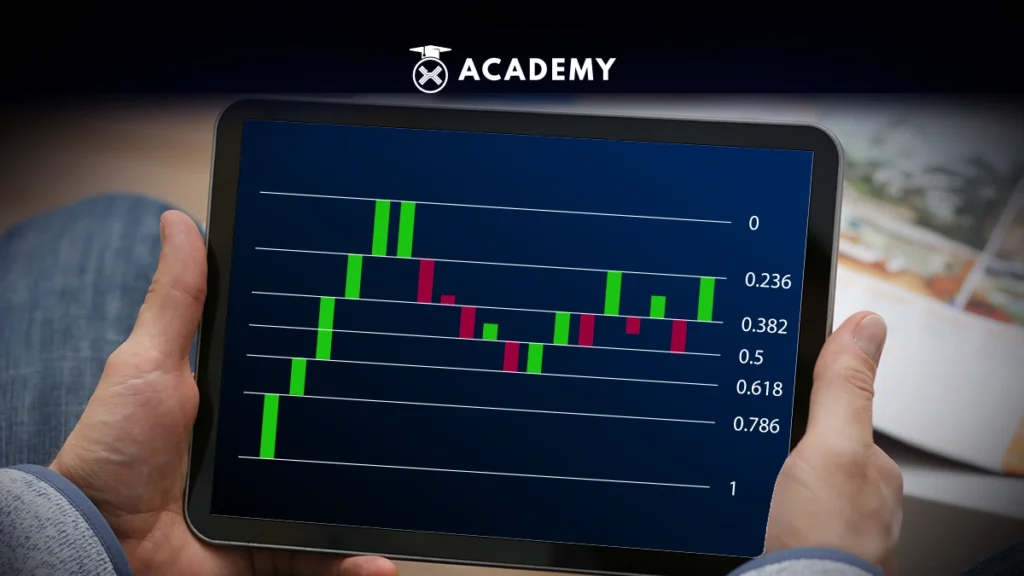
The Fibonacci retracement level is 23.6%; 38.2%; 61.8%; and 78.6%.
Several traders are known to add a value of 50% which is not a Fibonacci number.
This number can later be used as a guide when the retracement falls between 38.2% and 61.8%.
A pattern is drawn between the high and low points if you want to use this technique.
The numbers will then show the support and resistance levels between these points.
Fibonacci Retracement Indicator
The function of the Fibonacci retracement indicator is to determine price reversal levels.
Not only that but this one indicator can also be used to determine areas of support and resistance.
As reviewed above, this indicator will have a row of numbers 0%, 23.6%, 38.2%, 50%, 61.8%, and 100%.
Therefore, this technique which is very suitable for analyzing a trend differs from a setting indicator.
However, traders must be precise in placing this indicator so that the results are accurate.
Fibonacci history
As mentioned earlier, Fibonacci numbers were first discovered in Europe by Leonardo da Pisa (Leonardo Bigollo Pisano), better known as Leonardo Fibonacci.
He is a national mathematician who later became famous for introducing the writing system and calculating Arabic numbers/algorithms to the European continent.
Fibonacci wrote many books, one of the popular ones is also the basis for using Arabic numerals entitled Liber Abaci.
In that book, in chapter 12, to be precise, there is a problem that can disturb the mathematician’s common sense regarding the case of rabbits reproducing.
It takes more precision and foresight to answer these simple questions.
To answer this question, Fibonacci introduced the number sequence 0, 1, 1, 2, 3, 5, 8, 13, 21, 34, 55, 89, and so on.
The ratio exists in the proportion of forms in nature and becomes the basis for forming Fibonacci numbers.
Then, in that series, a ratio is found that is often found in every form of matter in nature, namely the ratio 1:1.618 or 0.618:1 or what is popularly known as the “Golden Ratio.”
How Fibonacci Works in Trading
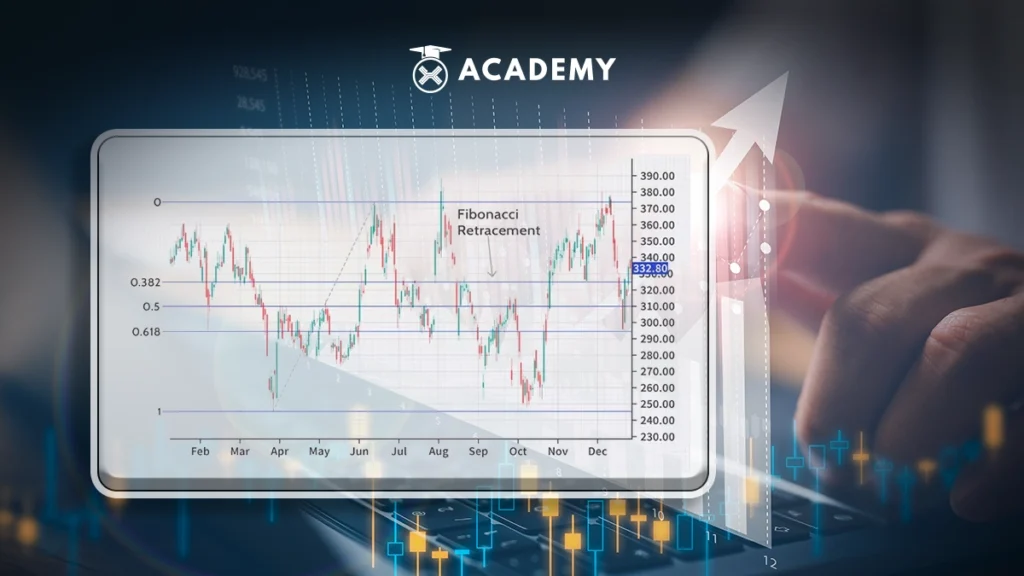
By using the Fibonacci retracement indicator, you will be able to determine a range of areas that have the potential to serve as support and resistance quite easily.
Besides that, this technique can also be appropriately used when the market is in a trending condition, both in an uptrend or downtrend position.
However, this indicator will become less effective if applied in a sideways market condition.
To be able to find Fibonacci levels, you must first find significant highs and lows.
These points are referred to as swing highs and swing lows. Fibonacci retracement has six levels, namely 0.0%, 23.6%, 38.2%, 50%, 61.8%, and 100%.
Meanwhile, the basic concept of using this technique is to look for buying opportunities when prices are in the support range and sell options when prices are in the resistance range.
For those of you who are beginners and have yet to study buy and sell signals, you can use this technique to read price movements.
How to Use Fibonacci Retracements
When using retracements, you are not afraid that later it will be difficult to find these Fibonacci formulas.
Most trading applications currently provide this one indicator complete with calculations.
As for after Fibonacci retracements are formed on your analysis chart, you will find that the trend will change every time the price gets closer to the l line level.
Furthermore, even though traders popularly use this technique, it can predict anything in chart form.
Advantages of Using Fibonacci Retracement in Trading
The advantage of using Fibonacci retracements in trading is that this is a technical indicator that, if used correctly, will tell traders definitively when to enter and exit the market with very little chance of loss.
On the other hand, even though a few traders find this technique confusing, this technique can be very profitable if applied in the right way and scenario.
Disadvantages of Using Fibonacci Retracement in Trading
Behind the advantages, of course, there are disadvantages to using Fibonacci retracements in trading.
The disadvantage for the trader when using this technique is that it takes time to understand.
If it needs to be better understood, it will be very safe when traders use this technique.
Therefore, traders are only advised to apply it for those who understand how to use this technique properly.
Conclusion
Many traders use Fibonacci retracement in buying and selling analysis, which can provide information such as support or resistance levels that other indicators do not have.
Introduced in Europe by a mathematician, Leonardo Bigollo Pisano (Fibonacci), this series of numbers formed a sequence known as the “Fibonacci Sequence.”
Meanwhile, this analysis technique consists of a 23.6% series; 38.2%; 61.8%; and 78.6%.
Besides that, some traders add a value of 50% which is not a Fibonacci number.
Now, after knowing the meaning of Fibonacci retracement and how to use it, you can also learn other interesting things like support resistance at Indodax Academy.
Later, if you understand it, you can also monitor today’s coin market price movements on Indodax Market.
Monitoring price movements is very important to ensure that you can make the right decisions and optimize the profit potential from crypto investments.
Good luck!
 Market

