In the trading world, one of the mathematical concepts often used by traders is the Fibonacci sequence.
The use of the Fibonacci series is generally applied by market players or traders with sufficient experience and expertise.
Fibonacci was first discovered by Leonardo of Pisa, better known as Leonardo Fibonacci, a mathematician in the 13th century.
Traders use the Fibonacci series in technical analysis. A method traders use to predict price movements of financial assets based on the history of past price movements.
What is the Fibonacci Sequence?
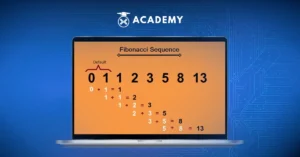
Quoting techtarget.com, a Fibonacci sequence is a collection of integers (Fibonacci numbers) that starts with 0, followed by 1, then 1 again, and so on, followed by a series of increasing numbers.
The sequence follows the rule that each number equals the sum of the previous two numbers. The Fibonacci sequence starts with the following 14 numbers:
0, 1, 1, 2, 3, 5, 8, 13, 21, 34, 55, 89, 144, 233…
Each number, starting from the third number, obeys the specified formula. For example, the seventh number, 8, is preceded by 3 and 5, which add up to 8 together.
Theoretically, this sequence can continue to infinity using the same formula for each new number.
Furthermore, some sources suggest that the Fibonacci sequence starts with a 1 instead of a 0, which is rare.
Understanding the Fibonacci Number Sequence
Quoting investopedia.com, the numbers in the Fibonacci sequence do not correspond to a specific formula but tend to have a certain relationship.
Each number is equal to the sum of the previous two numbers. For example, 0, 1, 1, 2, 3, 5, 8, 13, 21, 34, 55, 89, 144, 233, 377. Here are the rules of the Fibonacci sequence:
xn = xn-1 + xn-2
where:
- xn is sequence number “n”
- xn-1 is the previous term (n-1)
- xn-2 is the term before that (n-2)
Fibonacci Sequence in Trading
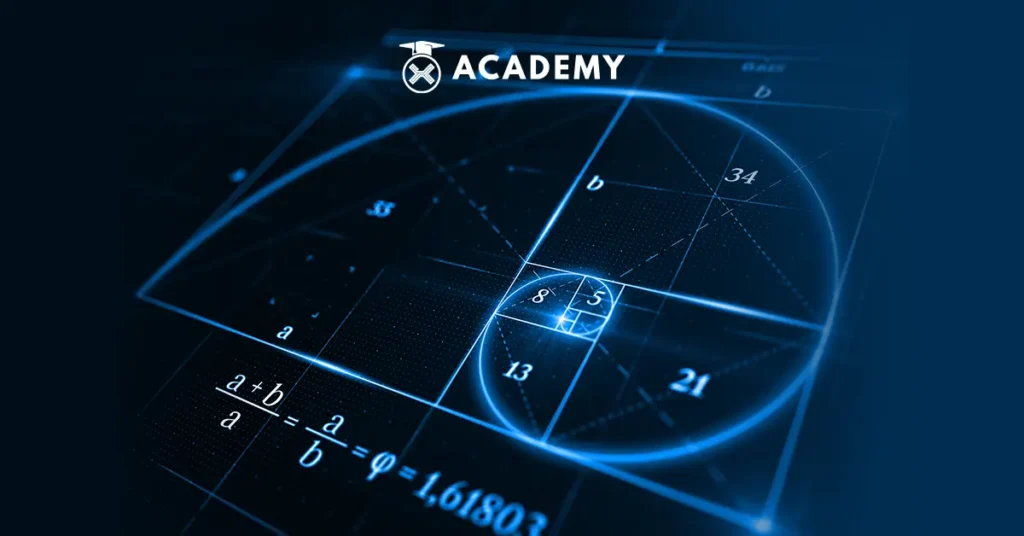
Quoting poems.co.id, one important aspect of the Fibonacci concept is understanding the Golden Ratio, also known as Phi (?).

Golden Ratio symbol or Greek letter Phi (?)
The Golden Ratio or Phi (?) is the division result between two consecutive numbers in the Fibonacci sequence.
The Golden Ratio consists of two values, namely 1.618 and 0.618. The term Golden Ratio itself is used because of the following two things:
- The result of dividing a Fibonacci number by the previous Fibonacci number is always close to 1.618.
- The result of dividing a Fibonacci number by the next Fibonacci number is always close to 0.618.
Getting to Know the Golden Ratio in Trading
Quoting hmarkets.com, the origin of the Fibonacci sequence and the Golden Ratio can be traced back to an ancient mathematician named Leonardo of Pisa, also known as Fibonacci.
In his book Liber Abaci, published in 1202, he introduced a sequence of numbers now known as the Fibonacci sequence.
The sequence starts with 0 and 1; each subsequent number is the sum of the previous two. The sequence appears in various natural phenomena, including plant and animal growth patterns.
Golden Ratio is a mathematical concept that describes the relationship between two quantities in which the ratio of the smaller quantity to the larger one is equal to the ratio of the larger quantity to the sum of the two.
The Golden Ratio is approximately equal to 1.6180339887 and is symbolized by the Greek letter Phi (?). The Golden Ratio has been observed in various natural and man-made structures and is considered a universal principle of beauty and harmony.
Meanwhile, quoting investopedia.com, although Fibonacci introduced these numbers to the Western world, they were discovered by Indian mathematicians hundreds of years earlier.
The poet Pingala used them to count the syllables of Sanskrit poetry around 200 BC (BCE), and his method was calculated by the Indian mathematician Virahanka around 800 years later.
In this sequence, each number is the sum of the previous two numbers (1, 1, 2, 3, 5, 8, 13, and so on).
However, this sequence is not the most important thing. The important part is that as the numbers get bigger, the quotient between each successive pair of Fibonacci numbers approaches 1.618, or its inverse, 0.618.
Many names, including golden, golden, divine, and divine proportions, know this proportion. So, why is this number so important?
Well, many things in nature have dimensional properties that follow the 1.618 ratio, so it seems to have a fundamental function for the basic elements of nature.
Some traders believe that Fibonacci numbers and the ratios produced by the sequence play an important role in finance that can be applied by traders using technical analysis.
Golden Ratio and Technical Analysis
Quoting investopedia.com, when used in technical analysis, the golden ratio is generally translated into three percentages, namely 38.2%, 50%, and 61.8%.
However, other multiples can be used, such as 23.6%, 161.8%, 423%, etc.
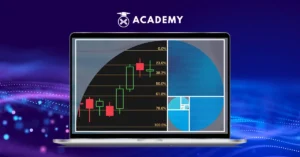
Meanwhile, the Fibonacci sequence can be applied to charts in four ways: retracements, arcs, fans, and time zones. However, not all of them may be available as it depends on the charting application being used. Here is the full explanation, namely:
1. Fibonacci Retracements
Fibonacci retracements utilize horizontal lines to identify support or resistance zones. The retracement levels are calculated based on the tops and bottoms of the chart. After that, five horizontal lines are drawn as follows:
- The first one at 100% (the highest point on the chart)
- The second at 61.8%
- The third one at 50%
- The fourth at 38.2%
- And the last one at 0% (the lowest point on the chart)
After significant price movements up or down, new support and resistance levels are often located at or close to these lines.
2. Fibonacci Arcs
Finding a chart’s highest and lowest points is the first step in creating Fibonacci Arcs. Then, with a compass-like motion, three curved lines are drawn at 38.2%, 50%, and 61.8% of the desired point. These lines anticipate the support and resistance levels and the trading range.
3. Fibonacci Fans
Fibonacci fans consist of diagonal lines. After finding the highest and lowest points of the graph, an invisible horizontal line is drawn through the rightmost point.
This invisible line is then divided into the 38.2%, 50%, and 61.8% levels, and lines are drawn from the leftmost point through each of these levels. These lines indicate support and resistance zones.
4. Fibonacci Time Zones
Unlike other Fibonacci methods, time zones are a series of vertical lines. Time zones are created by dividing the graph into segments with vertical lines spaced at intervals corresponding to the Fibonacci sequence (1, 1, 2, 3, 5, 8, 13, etc.). Each line indicates a time when a large price movement can be expected.
How to Use the Fibonacci Sequence?
Quoting investopedia.com, the Fibonacci Sequence can be applied in finance using four techniques: retracements, arcs, fans, and time zones.
Fibonacci Retracement requires two price points selected on the chart, usually a high and a low.
Once two points are selected, Fibonacci numbers and lines are drawn on the percentage of that movement. If the stock rises from $15 to $20, then the 23.6% level is $18.82, or $20 – ($5 x 0.236) = $18.82. The 50% level is $17.50, or $15 – ($5 x 0.5) = $17.50.
:max_bytes(150000):strip_icc():format(webp)/dotdash_INV-final-Fibonacci-Numbers-and-Lines-Definition-and-Uses-June-2021-01-cafe495212fa456db6d4a28a86376373.jpg)
Image source: Investopedia
Fibonacci Retracement is the most common form of technical analysis based on the Fibonacci series. During a trend, Fibonacci retracements can be used to determine how deep a correction may be.
Traders tend to pay attention to Fibonacci ratios between 23.6% and 78.6% at these times. If the price stops approaching one of the Fibonacci levels and then starts moving back toward the trend, then an investor can trade in the direction of the trend.
Arcs, fans, and time zones are similar concepts but applied to charts differently. Each concept indicates a potential area of support or resistance based on Fibonacci numbers applied to previous price movements.
These support or resistance levels can be used to project where prices may fall or rise.
How Fibonacci Sequence Can Affect Trading Behavior?
Quoting investopedia.com, humans tend to identify patterns and traders easily associate patterns on charts via the Fibonacci series.
It has not been proven that Fibonacci numbers are related to underlying market forces, but markets, by design, react to the beliefs of their participants.
Therefore, if investors buy or sell based on Fibonacci analysis, they will likely create predictions that come true, influencing market trends
Conclusion
In conclusion, the Fibonacci series in trading has an important role as a technical analysis tool.
Using Fibonacci Sequences, such as retracements, arcs, fans, and time zones, helps traders identify potential support and resistance levels and understand possible future price movements.
However, remember that even though the Fibonacci Sequence has become a popular instrument, there is still no guarantee of success.
Wise trading decisions require consideration of more than one analysis method and other factors, such as market conditions, economic news, and risk management.
Over-the-counter (OTC) Trading on INDODAX
So, now you understand what the Fibonacci Sequence is in trading, from understanding it to how to use it.
Next, if you want to use personal services to trade crypto assets in amounts that are too large to be processed through the order book, then you can visit the OTC trading page on INDODAX.
OTC service prices will always follow market price movements because transactions occur on the spot market. Even though the purchase nominal increases, this does not guarantee the price will be cheaper.
This service focuses on transaction convenience for members, where a special team will guide you through all procedures by ensuring security and guaranteeing user privacy.
So, what are you waiting for? Start OTC trading on INDODAX right now!
 Market

