Precisely what is Bullish Divergence? Let’s listen to the review!
This bullish divergence situation is generally the opposite of a bearish divergence signal.
So, consider the following review to determine how to use up to a series of advantages and disadvantages.
What is Bullish Divergence?
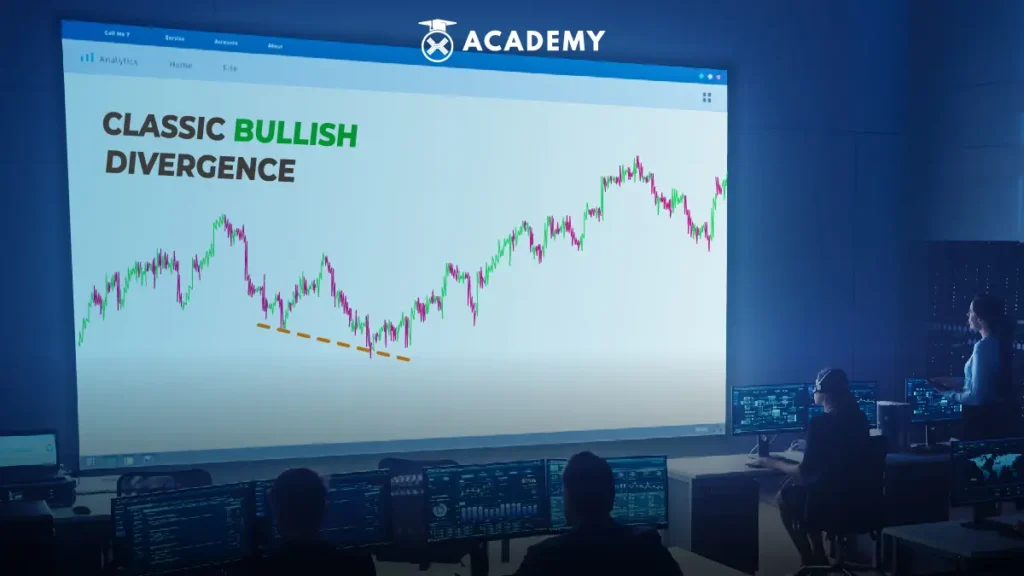
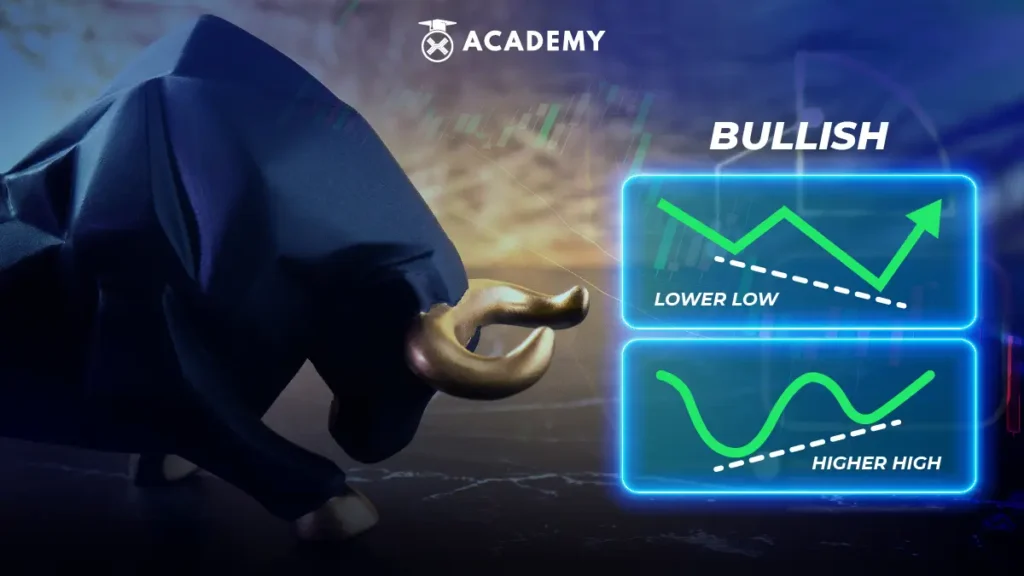
It can also be called convergence. Bullish Divergence is a market situation when the price forms a lower low.
At the same time, the selected indicator is in a higher low position. This is the first signal that traders should bet on an upward rally.
It should also be noted that this indicator is used to predict price direction.
Thus, if the indicator moves up, the price must go up.
The lower low is when there has been a price reduction. Then it returns to experience a lower price reduction than the previous price.
On the other hand, a higher low is when a price decline has occurred, but the price has increased again and is higher than the previous price.
How to Use Bullish Divergence in Trading?
Note there are several differences between bullish Divergence and other indicators. Here is the review.
1. Relative strength index
The relative strength index (RSI) is a technical analysis indicator generally used to measure the relative strength of the price volatility of the asset being traded.
RSI is known to measure the ratio between the attractiveness of price increases and the attractiveness of price reductions in a certain period.
The RSI line moves in the value range of 0-1 00. Meanwhile, the RSI indicator that penetrates 70 is often referred to as an “overbought” condition. Related to that, the price trend may weaken.
On the other hand, the RSI value, which reaches 30, indicates an “oversold” condition. As a result, there is a possibility that the price trend will continue to weaken.
A bullish divergence situation will occur if the asset price appears to be forming its latest low, but the RSI line rises and forms its newest point.
In this case, traders should be able to catch that a potential reversal from a downtrend to an uptrend will occur.
2. Moving Average Convergence Divergence
Moving Average Convergence Divergence (MACD) is a technical analysis indicator generally used to analyze the price movements of crypto assets.
Typically, MACD compares the difference between two exponential moving averages based on asset prices and displays the result as a histogram and a signal line.
MACD itself is an oscillator indicator developed from two main indicator lines.
The first line, namely the MACD line, is usually obtained by subtracting the Exponential Moving Average (EMA) within 12 sessions (12 periods) with the EMA with a time frame of 26 sessions (26 periods).
Trading Strategy Using Bullish Divergence
Of course, it is important to understand how to spot divergences to make better trading decisions.
If you already know how it will be easier to find out about trading strategies in divergence market conditions.
One of the keys to success that can be done is to enter a trade at the right time.
That’s because the haste to make a decision will cause problems.
In this case, patience is needed to seek confirmation from price action. The price confirmation occurs when the price has crossed the trend line.
Another thing that is also important is when the price has penetrated the support and resistance levels.
If you get one of these confirmations, then that’s the right time to enter a trade.
Besides that, you can also place a stop-loss above the upper limit and below the lower limit for the reversal.
Placing stop-losses can help you to be on the safe side to avoid unexpected price movements.
One of the ways to get better returns during Divergence is by setting precise and wise profit targets.
In this case, the most common method that can be used to determine profit is to draw a trend reversal line.
Advantages and Disadvantages of Bullish Divergence
Like other trading signals, the bullish divergence pattern has advantages and disadvantages. Here’s the explanation!
1. Excess
- Bullish Divergence is often seen as a reliable signal to read a reversal.
- This situation helps traders to acquire trading opportunities in the short term.
2. Lack
- Sometimes, novice traders need to catch this signal. Thus, before becoming proficient at spotting bullish divergence signals, novice traders must be patient and must spend time listening to trading charts.
- This indicator sometimes gives “false” reversal signals. It makes traders need to confirm that situation with other technical indicators.
Conclusion
It is the opposite of a bearish divergence signal, bullish Divergence is a situation in technical analysis when the price of an asset decreases, but technical indicators show an increase.
There are several differences between bullish Divergence and other indicators, including the Relative strength index and the Moving Average Convergence Divergence.
Meanwhile, the advantage of bullish Divergence is that this situation is often seen as a reliable signal to read a reversal and help traders to get short-term trading opportunities.
On the other hand, the drawback is that traders often fail to see this signal. Besides, sometimes this indicator gives a “false” reversal signal.
Apart from Bullish Divergence, you can also learn other patterns, such as the cup and handle pattern, to make trading easier.
Well, after you know how to read it, now is the time for you to try trading crypto.
However, before trading, it’s a good idea to know the price of the crypto coin market on Indodax!
 Market

