This month we will recommend several crypto asset, one of which is Alternative Coins, that hopefully can help your portfolio in the green. Let’s find out more!
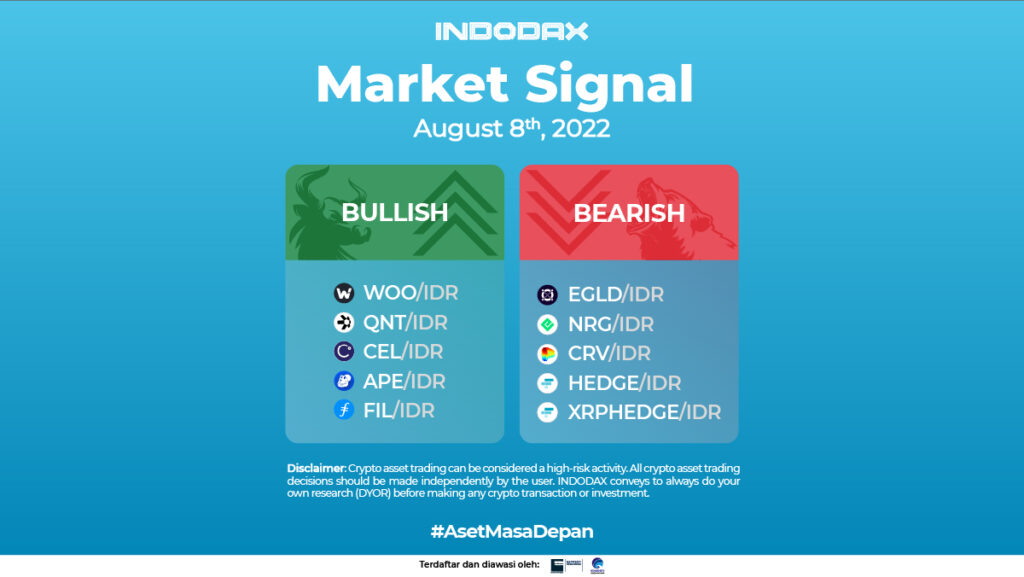
5 Bullish Crypto Assets
-
WOO Network (WOO)
This crypto asset, The increase started on July 20, 2022 when the price was able to break the EMA/200 line at the price of 2.640. The bullish trend caused prices to increase further, one of which was on July 30, 2022 when WOO Network touched 5,500, which was the highest price since April 2022.

The two lines of the Bollinger Bands indicator are moving away from each other or widening, which indicates the price will move more volatile. The trend direction in the bullish phase will be stronger, if a candle can form and stay above the resistance level of 4.470.
-
Quant (QNT)
Next for crypto asset Quant (QNT) was confirmed to be in a bullish phase on July 09, 2022, which was marked by EMA/75 and the EMA/85 lines crossed above the EMA/200 and was able to break the 991,000 price level.
On the 4-hour chart, the RSI indicator shows that the price is already in the oversold area which is normal because the Quant price has risen fairly high, while the MACD indicator is in a positive area with a positive histogram.

The increase will test 2.020,000, if this level is broken, it will test 2,270,000 price level. Meanwhile, the closest support level is at 1.660,000
-
Celsius (CEL)
After breaking through the 13,000 level and entering the bullish zone, the increase of Celsius has been quite significant ever since, it has risen to around 60%. The RSI indicator shows that the chart is currently in the overbought area, the buying pressure is quite massive.
The bullish trend can reverse direction if the price weakens, marked by the break of the WMA/75 and WMA/85 lines, there is a fairly strong support level at the price range of 18,300 – 20,000.

-
ApeCoin (APE)
It started off with breaking through the EMA/200 line on July 18, 2022, the candle was then able to stay above that line and strengthen further. The buying dominated the selling pressure. It decreased to 82,600 level, but the price rose again and penetrated the resistance level at 91,000.
In the 4-hour time frame, the MACD indicator shows a negative trend. The strengthening will test 113,600 – 114,700 price level. If this level is broken the bullish phase will strengthen.

-
Filecoin (FIL)
After previously moving sideways for quite some time in the price range of 76,400 – 91,300 until July 30, 2022, it was able to break the resistance level which caused the price to strengthen by up to 59% so far. If the price is able to break through the 146,200 price level, it will test the resistance level at 167,000.

5 Bearish Crypto Assets
-
Elrond (EGLD)
In the 1-day time frame EGLD has been in a bearish phase since 04 February 2022, it broke the EMA/200 line, but the candle was unable to break the 3,065,000 price level, the decline was quite deep, starting from 04 February 2022 to date, Elrond has fallen of up to 70%.

The MACD indicator shows that the trend is positive, it will test the 1.070,000 – 1,139,000 price level. If this level is broken, it will test the 1,234,000 price.
-
Energi (NRG)
The 1-day time chart illustrates that at the end of the candle there is often a positive or negative axis indicating that both the supply and demand are quite balanced, therefore the price positions must be well thought of.

Bearish trend can reverse if the price is able to strengthen and stay above the WMA/75 and WMA/85 lines, which is also followed by a breakout above the resistance level at 13,900. Meanwhile, if the weakening occurs, the trend will try to make a candle below the 5,700 level.
-
Curve DAO Token (CRV)
The decline started when the price was unable to stay above the 55,900 price level and it broke the EMA/200 instead. On February 26 was confirmed to be in the bearish zone. The bearish trend will be broken if the price can break through the 23,500 price level and a candle forms above the EMA/200 line.

The Curve DAO Token will test the Support level of 18.360, if it is broken, the price direction will try to break through WMA/75 and WMA/85.
-
1x Short Bitcoin Token (HEDGE)
The decline occurred on July 20, 2022, in line with the decline of the main coin Bitcoin, which is experiencing a weakening as the price was unable to stay above the 2.030,000 price level.

The MACD indicator is signaling that HEDGE is experiencing sideways where the price movement is limited to the price range of 1,753,000 – 1,803,000. A break of one of these lines will determine the price direction of the 1x Short Bitcoin Token.
-
1X Short XRP Token (XRPHEDGE)
On the 4-hour chart it shows that 1X Short XRP Token is trying to break through the WMA/75 line at 949.345, if this line is broken then the trend direction in the bearish zone will be wide open, assuming a candle is able to form and the price will try to go towards the EMA/ 200.

The price movement is more limited with MACD and Bollinger Bands indicators showing narrowing lines, the price moves in the price range of 937,000 – 957,000.
NOTE: If the 5 EMA crosses the WMA 75, 85 and 200 EMA lines and the lines intersect from the bottom up, then the market trend tends to go up (bullish), each table above shows that if the 5 EMA value is higher than the 75.85 WMA and 200 EMA, the market tends to go up (bullish).
If the RSI and MACD values ??show the same condition, it means that the market is showing the same trend. Overbought or oversold conditions are an indicator that the market is already at the point of changing direction of a trend.
ATTENTION: All contents which includes text, analysis, predictions, images in the form of graphics and charts, as well as news published on this website, is only used as trading information, and is not a recommendation or suggestion to take action in transacting either buying or selling. certain crypto assets. All crypto asset trading decisions are independent decisions by the users. Therefore, all risks arising from it, both profit and loss, are not the responsibility of Indodax.
 Market

