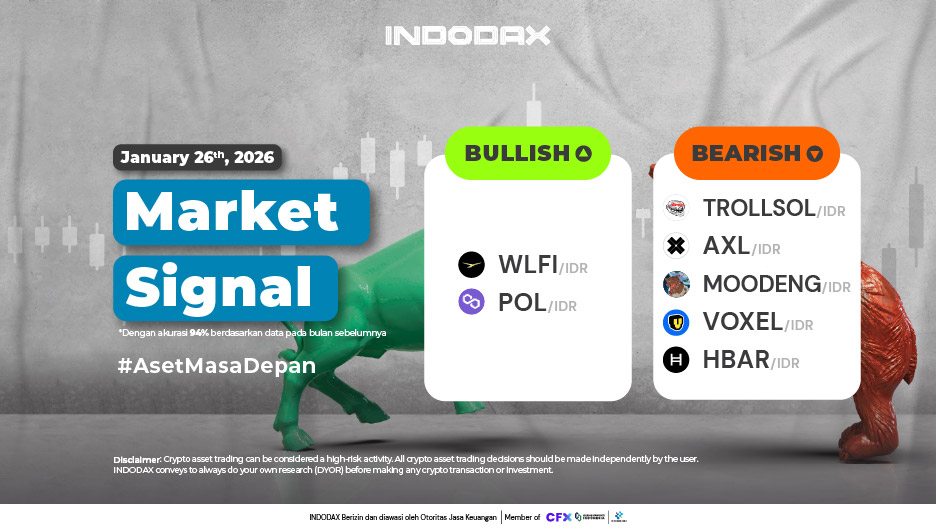
This week, the bullish crypto lineup is led by World Liberty Financial (WLFI) in first place, followed by Polygon Ecosystem Token (POL).
Want to know how your favorite crypto asset is performing? Check INDODAX Market Signal below!
2 Bullish Crypto Assets
1.World Liberty Financial (WLFI)

The 2,500 – 2,650 support area is crucial for the BUllish phase of World Liberty Financial (WLFI). If it is broken, the candle will most likely move below the EMA/200.
2.Polygon Ecosystem Token (POL)
The bullish phase is experiencing negative pressure, with the candlesticks currently moving below the 200-EMA, thus increasing the chances of Polygon Ecosystem Token (POL) ending this phase. The 1,800-2,000 support level is crucial; failure to hold it will positively impact the Polygon Ecosystem Token (POL) trend.
5 Bearish Crypto Assets
1.TROLL (SOL) (TROLLSOL)
Having made a candle above the EMA/200, it did not receive support from positive momentum. Resistance 600 – 700 failed to be penetrated, causing TROLL (SOL) (TROLLSOL) to respond negatively with the trend weakening again, moving below the EMA/200.
2.Axelar (AXL)
Still unable to move higher, Axelar (AXL) is still moving below the WMA/85 where the nearest resistance is in the 1,800 – 3,000 area.
3.Moo Deng (MOODENG)
A downward trend correction can be formed by the candlestick remaining above the 1,100-1,350 area, which is an indication of strengthening, and the previously formed sideways trend will end.
4.Voxies (VOXEL)
Failure to break through the 200-EMA is an indication that negative momentum is currently dominating the trend change in Voxies (VOXEL). Resistance at 280-360 is quite important for Voxies (VOXEL), and if the 200-EMA breaks, it’s highly likely that it will also break through.
5.Hedera (HBAR)
Still under pressure from the WMA/85, Hedera (HBAR) has not made significant gains, while the WMA/85 is likely to be broken through by breaking through the Resistance of 2,200 – 2,700.
NOTE: If the 5 EMA crosses the WMA 75, 85 and 200 EMA lines and the lines intersect from the bottom up, then the market trend tends to go up (bullish), each table above shows that if the 5 EMA value is higher than the 75.85 WMA and 200 EMA, the market tends to go up (bullish).
If the RSI and MACD values ??show the same condition, it means that the market is showing the same trend. Overbought or oversold conditions are an indicator that the market is already at the point of changing direction of a trend.
ATTENTION: All contents which includes text, analysis, predictions, images in the form of graphics and charts, as well as news published on this website, is only used as trading information, and is not a recommendation or suggestion to take action in transacting either buying or selling. certain crypto assets. All crypto asset trading decisions are independent decisions by the users. Therefore, all risks arising from it, both profit and loss, are not the responsibility of Indodax.
 Market