This week, the bullish crypto lineup is led by Pax Gold (PAXG) in first place, followed by Tron (TRX) .
Want to know how your favorite crypto asset is performing? Check INDODAX Market Signal below!
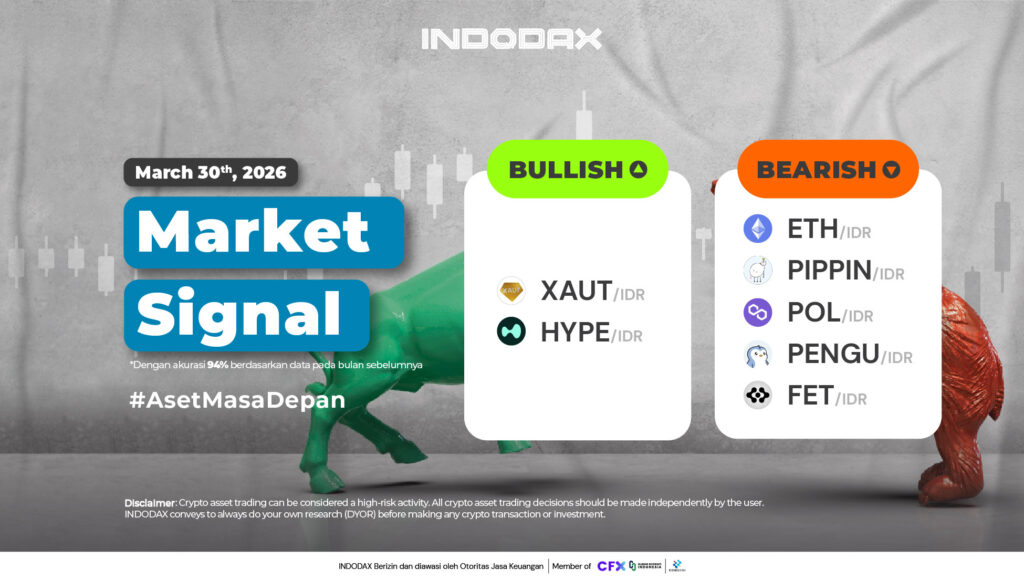
2 Bullish Crypto Assets
1.Tether Gold (XAUT)
The weakening that occurred in Tether Gold (XAUT) was held back by the EMA/200, staying above this line will open up opportunities for Tether Gold (XAUT) to strengthen again and remain in the Bullish zone.
2.Hyperliquid (HYPE)
Hyperliquid (HYPE) has been confirmed to be in an Uptrend phase since March 5, 2026, if the trend manages to stay above the 750,000 – 900,000 area, it will gradually create positive changes in the price of Hyperliquid (HYPE).
5 Bearish Crypto Assets
1.Ethereum (ETH)
The nearest resistance is in the 40,000,000 – 45,000,000 area. The trend has not yet managed to pass through this area. The candle is moving negatively with the MACD indicator showing a downward crossover.
2.Pippin (PIPPIN)
The 4-Hour chart shows that Pippin (PIPPIN) experienced a significant correction, after moving sideways in the price range of 5,000 – 7,000 with a negative ending, Pippin (PIPPIN) showed that selling momentum dominated price changes.
3.Polygon Ecosystem Token (POL)
Negative changes align with the trend moving below the 85-day moving average (WMA), indicating a wide open opportunity for Polygon Ecosystem Token (POL). Support is indicated around 1,400, and a new low will be established if it is broken.
4.Pudgy Penguins (PENGU)
Several attempts to stay above the EMA/200 failed, and the resistance level of 135-145 must be broken. This will encourage the trend to strengthen.
5.Artificial Superintelligence Alliance (FET)
A trend improvement can occur if the candlesticks are able to stay above 6,000 – 8,000. This can also encourage the trend to stay above the EMA/200.
NOTE: If the 5 EMA crosses the WMA 75, 85 and 200 EMA lines and the lines intersect from the bottom up, then the market trend tends to go up (bullish), each table above shows that if the 5 EMA value is higher than the 75.85 WMA and 200 EMA, the market tends to go up (bullish).
If the RSI and MACD values ??show the same condition, it means that the market is showing the same trend. Overbought or oversold conditions are an indicator that the market is already at the point of changing direction of a trend.
ATTENTION: All contents which includes text, analysis, predictions, images in the form of graphics and charts, as well as news published on this website, is only used as trading information, and is not a recommendation or suggestion to take action in transacting either buying or selling. certain crypto assets. All crypto asset trading decisions are independent decisions by the users. Therefore, all risks arising from it, both profit and loss, are not the responsibility of Indodax.
 Market