
Hello, Indodax member. This time, we will discuss 5 crypto assets that are bullish and bearish for the next week on the Indodax Market. From 7 December – 11 December 2020, which crypto assets have increased and which have fallen?
The 5 bullish and bearish crypto assets this week are almost the same as the previous week. There are only a few crypto-assets that change. Check out the reviews:
5 Bullish Crypto Assets This Week
- Bitcoin (BTC)
It’s been more than a month, the king of cryptocurrency, Bitcoin, is still increasing in price. Likewise next week. This crypto asset is also predicted to experience an increase in price.
The impact of this Bitcoin increase is still the same as the previous increase. The increase in Bitcoin is due to the massive purchase of Bitcoin by several giant companies in the United States (US). This is done in protecting their assets.
The uncertainty of US policy after the presidential election made many people secure their assets in Bitcoin. Not only that, the PayPal factor is also still a support that makes the price of Bitcoin go up.
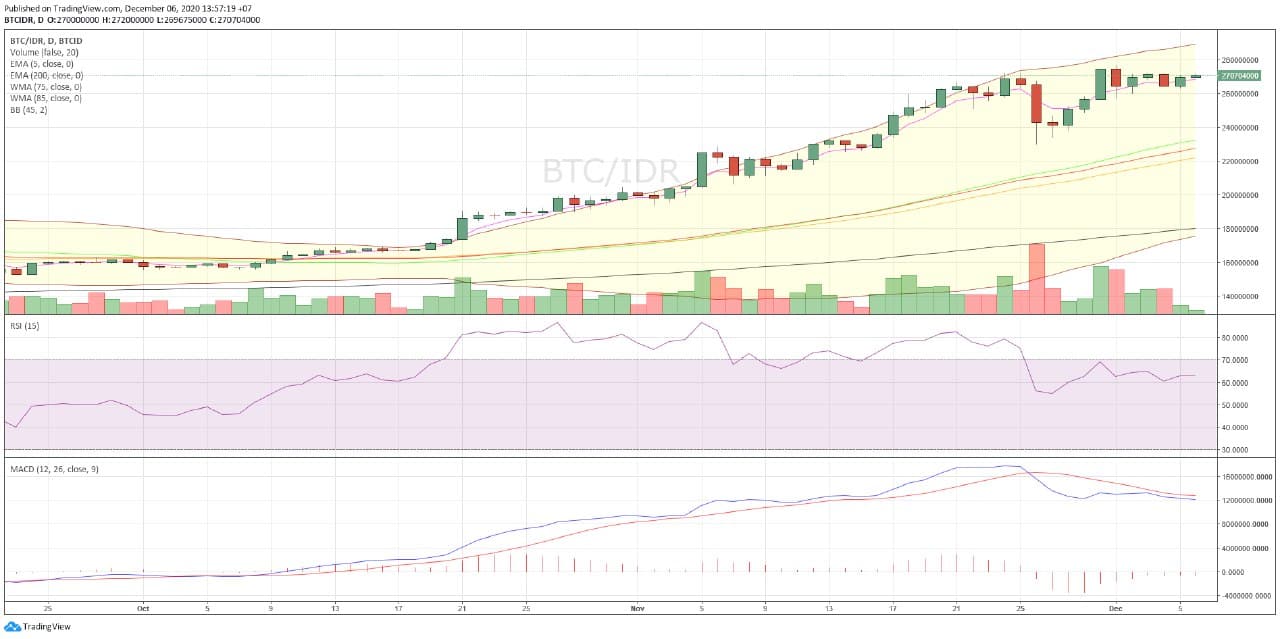
Chart Bitcoin/IDR
In today’s trading, BTC moved at the lowest level of IDR268,291,000 and the highest level was IDR272,000,000.
Here’s BTC’s technical analysis this week:
| Action | ||
| EMA 5 | 268,549,987 | buy |
| WMA 75 | 227,513,607 | buy |
| WMA 85 | 221,927,425 | buy |
| EMA 200 | 180,134,061 | buy |
| RSI (15) | 63.0186 | buy |
| MACD 12,26 | 12100892.41 | Buy |
| Summary | BUY | |
| Bullish |
- Ethereum (ETH)
Ethereum (ETH) is the second most popular crypto asset after Bitcoin is also predicted to increase this week. Still with the previous reason, the demand for ETH is increasing because people are enthusiastic about welcoming the evolution of Ethereum 2.0.
This evolution will upgrade the old Ethereum network to a more effective ethereum network. In addition, ETH 2.0 will also be efficient in use, thus triggering price increases.
Ethereum 2.0 will enlarge its network and turn the scheme to proof of staking (PoS) from the original PoW (Proof of Work) scheme. This is the reason why ETH continues to increase.
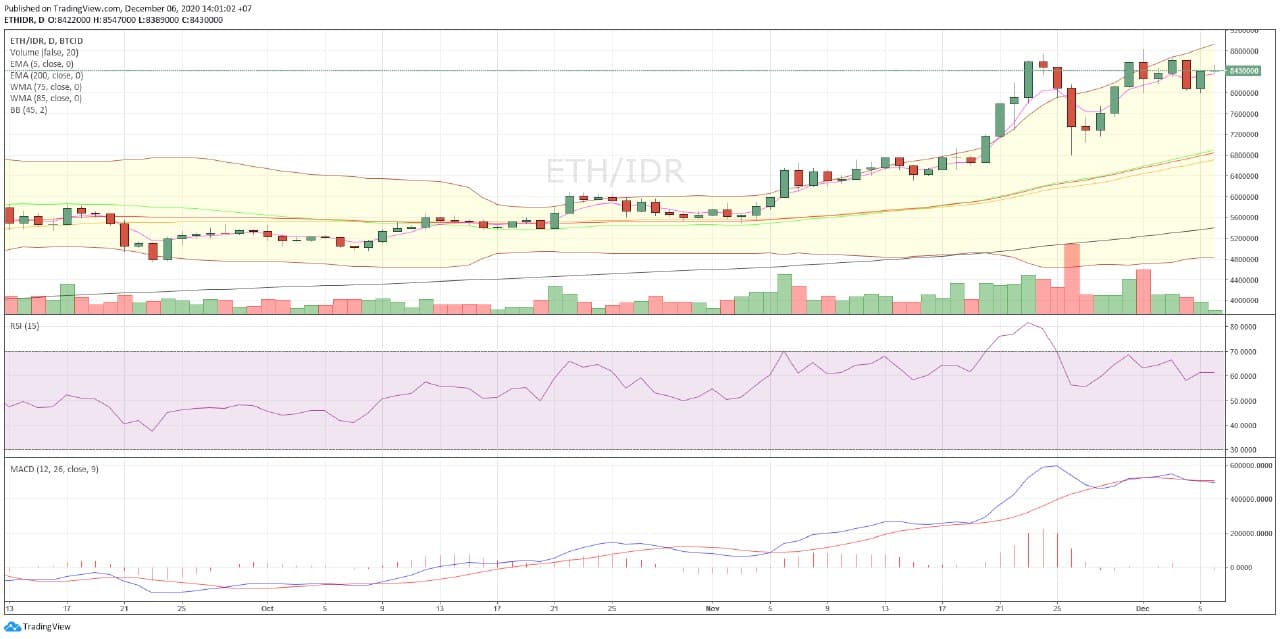
Chart ETH/IDR
In today’s trading, ETH moved at the lowest level of IDR8,286,000 and the highest level was IDR8,547,000. ETH entered into 5 bullish crypto assets this week.
Here’s the ETH technical analysis for this week:
| Action | ||
| EMA 5 | 8,355,360 | buy |
| WMA 75 | 6,844,802 | buy |
| WMA 85 | 6,706,188 | buy |
| EMA 200 | 5,391,874 | buy |
| RSI (15) | 61.4189 | buy |
| MACD 12,26 | 494997.6075 | buy |
| Summary | BUY | |
| Bullish |
- Sushiswap (SUSHI)
SushiSwap (SUSHI) is a crypto asset based on Decentralized Finance or DeFi. This crypto asset is still newly listed on Indodax. The increase occurred because the Sushiswap platform was very popular.
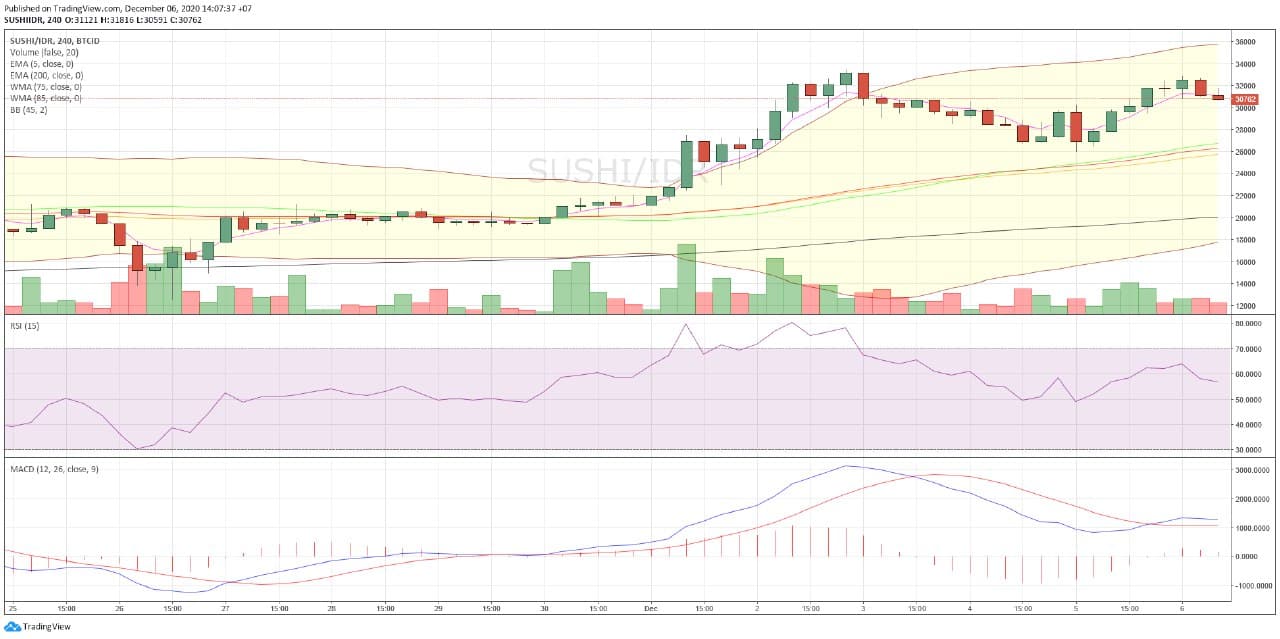
Chart SUSHI/IDR
In today’s trading, Sushi moved at the lowest level of 29,100 and the highest level of 32,898. SUSHI has entered into 5 bullish crypto assets this week.
Here’s the SUSHI technical analysis for this week:
| Indikator | Action | |
| EMA 5 | 31,042 | buy |
| WMA 75 | 22,849 | buy |
| WMA 85 | 22,657 | buy |
| EMA 200 | 18,050 | buy |
| RSI (15) | 65.7532 | buy |
| MACD 12,26 | 2998.0336 | buy |
| Summary | Buy | |
| Bullish |
- Stellar Lumens (XLM)
Stellar Lumens (XLM) The next coin to be the 5 bullish crypto assets this week. XLM is a crypto asset that is quite popular and has strong fundamentals and utility.
Many people make purchases at XLM. So that the price in early December 2020 is predicted to increase.
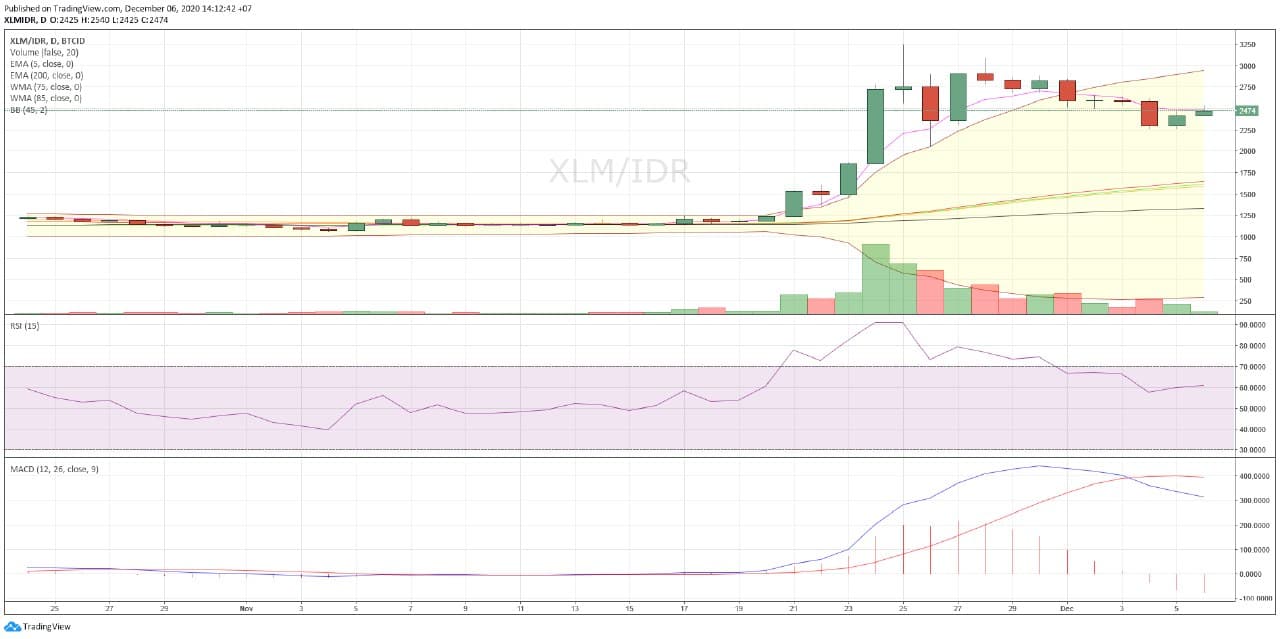
Chart XLM/IDR
In today’s trading, XLM moved at the lowest level at Rp2,479 and the highest level at Rp2,540. XLM entered into 5 bullish crypto assets this week.
Following is the XLM technical analysis for this week.
| Indikator | Action | |
| EMA 5 | 2,483 | buy |
| WMA 75 | 1,648 | buy |
| WMA 85 | 1,593 | buy |
| EMA 200 | 1,335 | buy |
| RSI (15) | 61.0618 | buy |
| MACD 12,26 | 316.2972 | buy |
| Summary | BUY | |
| Bullish |
- Ripple (XRP)
Ripple (XRP) is the next coin to be the 5th bullish crypto asset this week. Demand is still increasing drastically because XRP will do an Airdrop of Spark tokens. People are ‘taking positions’ to get the Spark Token airdrop planned for December 12, 2020.
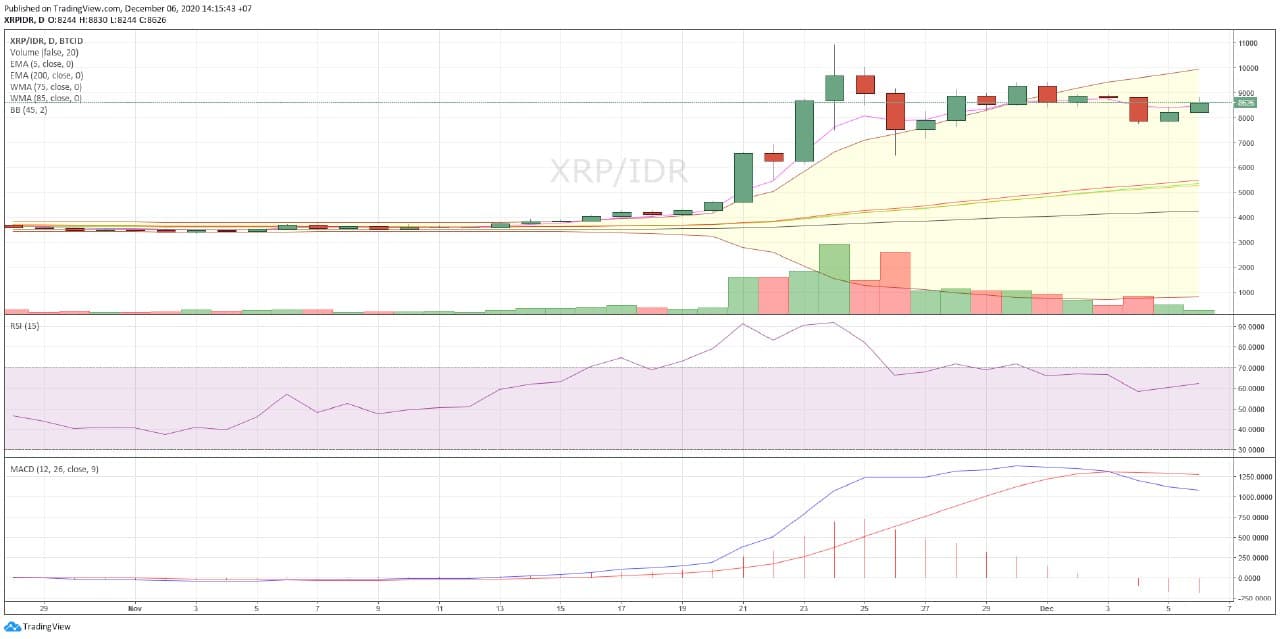
Chart XRP/IDR
In today’s trading, XRP moved at the lowest level of IDR 8,143 and the highest level of IDR 8,830. XRP entered into 5 bullish crypto assets this week.
Here’s the XRP technical analysis for this week:
| Indikator | Action | |
| EMA 5 | 8,472 | buy |
| WMA 75 | 5,488 | buy |
| WMA 85 | 5,291 | buy |
| EMA 200 | 4,255 | buy |
| RSI (15) | 62.4365 | buy |
| MACD 12,26 | 1081.405 | buy |
| Summary | BUY | |
| Bullish |
Here Are 5 Bearish Crypto Assets This Week
- Vexanium (VEX)
Vexanium (VEX) is a crypto asset originating from Indonesia. Unfortunately, this innovation in domestic crypto assets has not been able to raise its price performance in the crypto asset market. Vexanium is a crypto asset which is expected to be bearish this week.
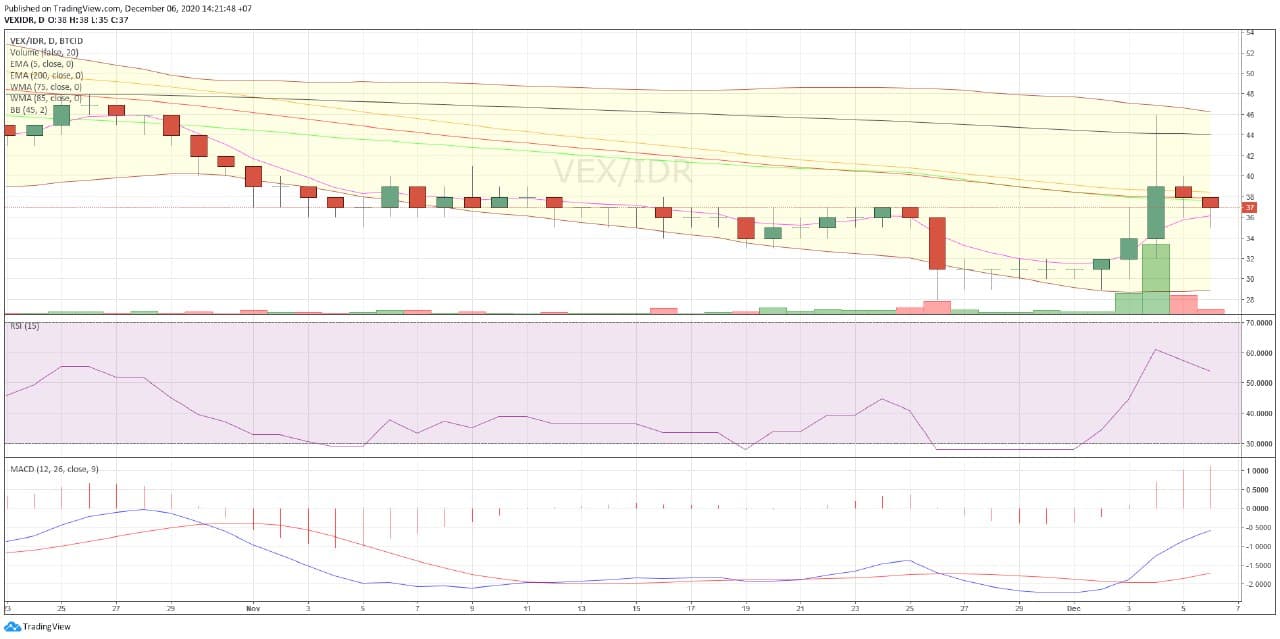
Chart VEX/IDR
In mid-year trading, VEX moved at the lowest level at Rp35 and the highest level at Rp39.
Here’s this week’s VEX technical analysis:
| Action | ||
| EMA 5 | 36 | sell |
| WMA 75 | 37 | sell |
| WMA 85 | 38 | sell |
| EMA 200 | 44 | sell |
| RSI (15) | 53.9705 | sell |
| MACD 12,26 | -0.5933 | oversold |
| Summary | SELL (5) OVERSOLD (1) | |
| Bearish |
- Attila (ATT)
Attila (ATT) is the next crypto asset to experience a price drop. This crypto asset has decreased in demand.
Attila is a decentralized information communication protocol based on blockchain technology. It is committed to providing autonomous cross-platform communication solutions for global social networks.
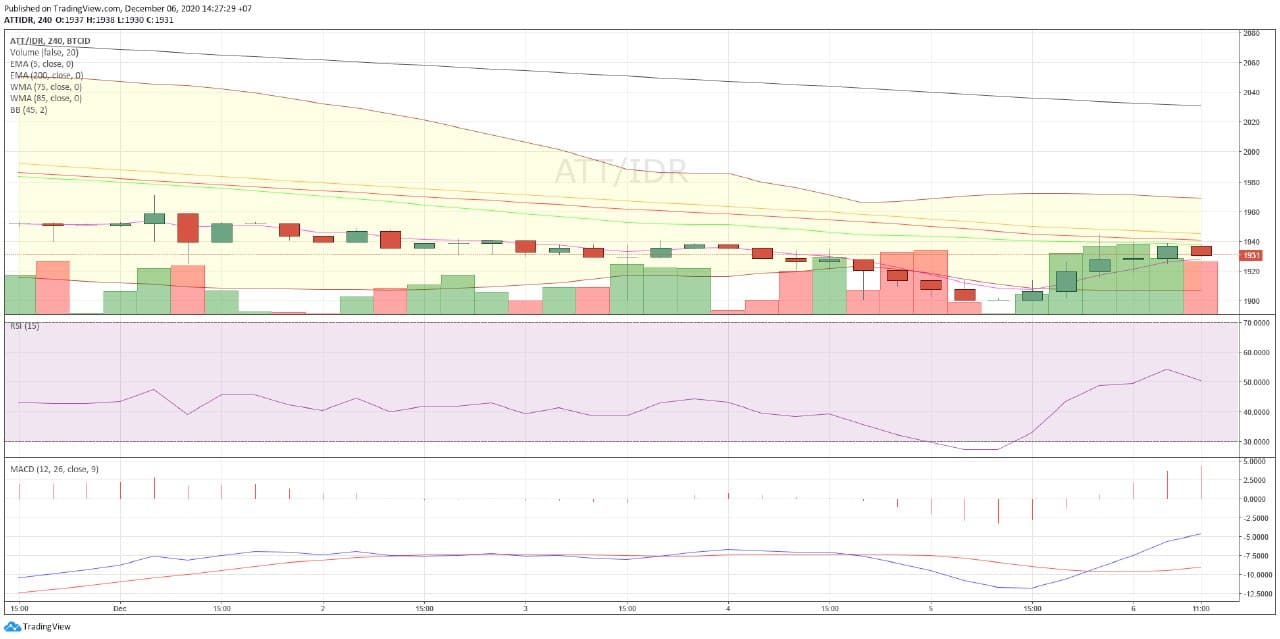
Chart ATT/IDR
In today’s trading, ATT is moving at the low of 1901 and the highest level of 1945
Here’s the ATT technical analysis for this week:
| Action | ||
| EMA 5 | 1,928 | sell |
| WMA 75 | 1,840 | sell |
| WMA 85 | 1,945 | sell |
| EMA 200 | 2,030 | sell |
| RSI (15) | 51.5924 | sell |
| MACD 12,26 | -4.6076 | oversold |
| Summary | SELL (5) Oversold (1) | |
| Bearish |
- Sumokoin (SUMO)
Sumokoin (SUMO) is a mining-based crypto asset. SUMO is considered unable to innovate so that investors have abandoned it.
The number of investors who left caused SUMO’s price to move down. In today’s trading, SUMO moved at the lowest level of IDR 492 and the highest level of IDR 498.
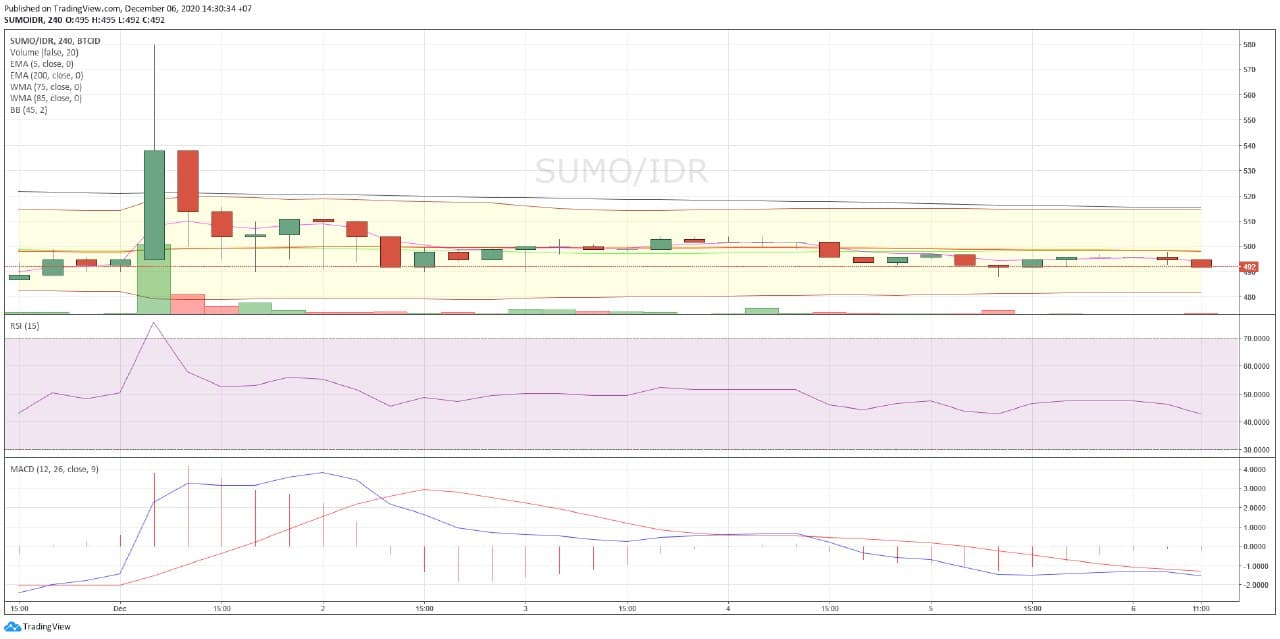
Chart SUMO/IDR
Here’s SUMO’s technical analysis for this week:
| Indikator | Action | |
| EMA 5 | 494 | sell |
| WMA 75 | 497 | sell |
| WMA 85 | 498 | sell |
| EMA 200 | 515 | sell |
| RSI (15) | 42.8786 | sell |
| MACD 12,26 | -1.5473 | oversold |
| Summary | SELL (5) Oversold (1) | |
| Bearish |
- Crypto.com (CRO)
Crypto.com is one of the most popular crypto assets. It’s just that Crypto.com hasn’t been able to innovate to retain its investors.
Thus, causing the price to decrease. Just like the previous weeks.
So that CRO entered into 5 bearish crypto assets this week.
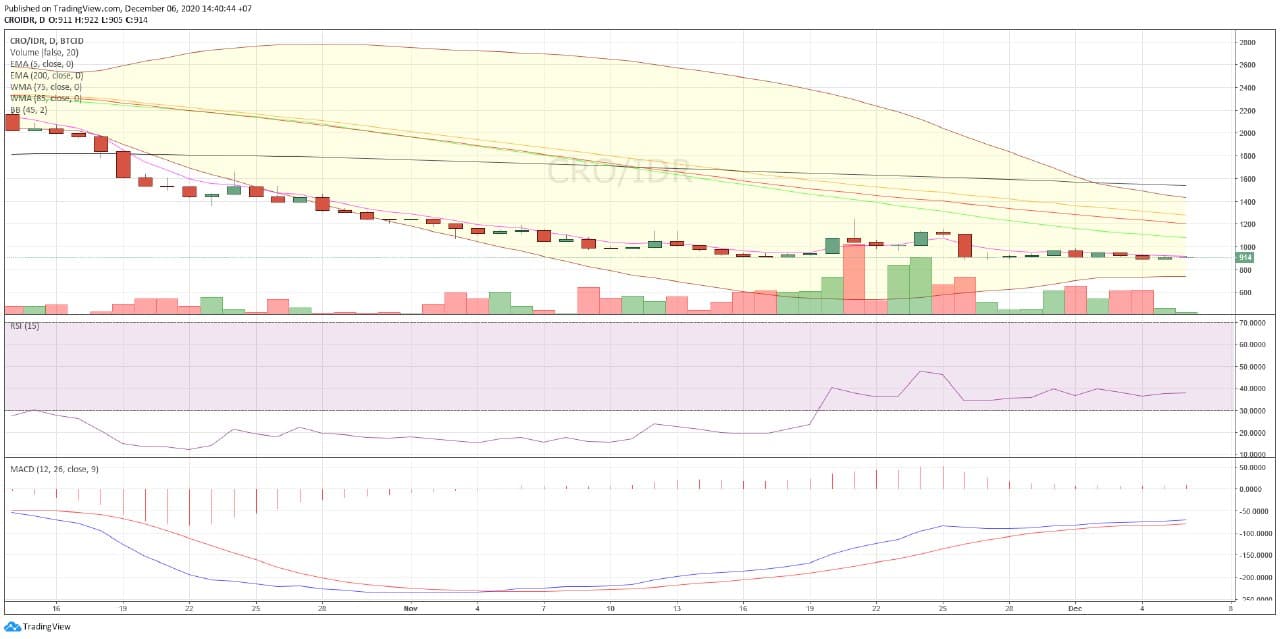
Chart CRO/IDR
In today’s trading, the CRO moved at the lowest level at Rp905 and the highest level at Rp923.
Here’s the CRO technical analysis for this week:
| Action | ||
| EMA 5 | 938 | sell |
| WMA 75 | 981 | sell |
| WMA 85 | 982 | sell |
| EMA 200 | 1,137 | sell |
| RSI (15) | 48.9448 | neutral |
| MACD 12,26 | -12.8765 | oversold |
| Summary | SELL (4) Neutral (1) OVERSOLD(1) | |
| Bearish |
- Tether (USDT)
Tether (USDT) continues to decline. This crypto asset has entered into 5 bearish crypto assets this week. In the last few weeks, the USDT has indeed experienced a decline. USDT is a stable coin that adheres to the price of US Dollar.
After the US Presidential election, the country’s economy experienced a slight decline. This is why the US Dollar has decreased which causes the USDT to also decline.
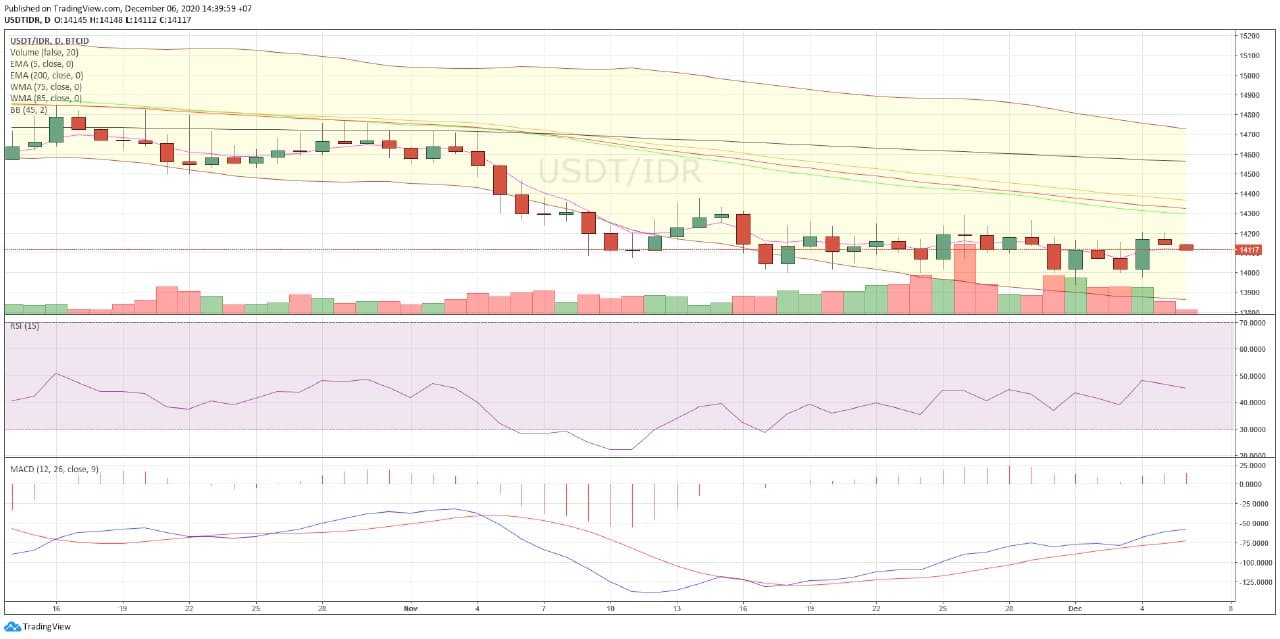
Chart USDT/IDR
In today’s trading, USDT moved at the lowest level of IDR14,112 and the highest level was IDR14,193.
Here’s the USDT technical analysis for this week:
| Indikator | Action | |
| EMA 5 | 14,118 | sell |
| WMA 75 | 14,324 | sell |
| WMA 85 | 14,366 | sell |
| EMA 200 | 14,564 | sell |
| RSI (15) | 46.8554 | neutral |
| MACD 12,26 | 61.0214 | oversold |
| Summary | SELL (4) Neutral (1) OVERSOLD(1) | |
| Bearish |
NOTE: If the EMA 5 crosses the WMA 75, 85 and 200 EMA and these lines intersect from bottom to top, the market trend tends to go up (bullish),
In each table above, it shows that if the value of EMA 5 is higher than WMA 75.85 and EMA 200 then the market tends to rise (bullish).
If the RSI and MACD values ??show the same condition, it means that the market is showing the same trend, overbought condition or oversold condition is an indicator that the market is at a point of changing the trend direction.
ATTENTION: All content which includes text, analysis, predictions, images in the form of graphics and charts, as well as news contained in this website, is only used as trading information only, and does not constitute a suggestion or suggestion to take an action in a transaction either buying or selling certain crypto assets. All crypto asset trading decisions are independent decisions by the user. Therefore, all risks arising from it, whether it is profit or loss, are not the responsibility of Indodax.
 Market

