This week, the ranks of bullish crypto assets are led by Tron (TRX) in the first position, and followed by Pax Gold (PAXG) and BinaryX (BNX)
Want to know the performance of your favorite crypto assets? Check INDODAX Market Signal below!
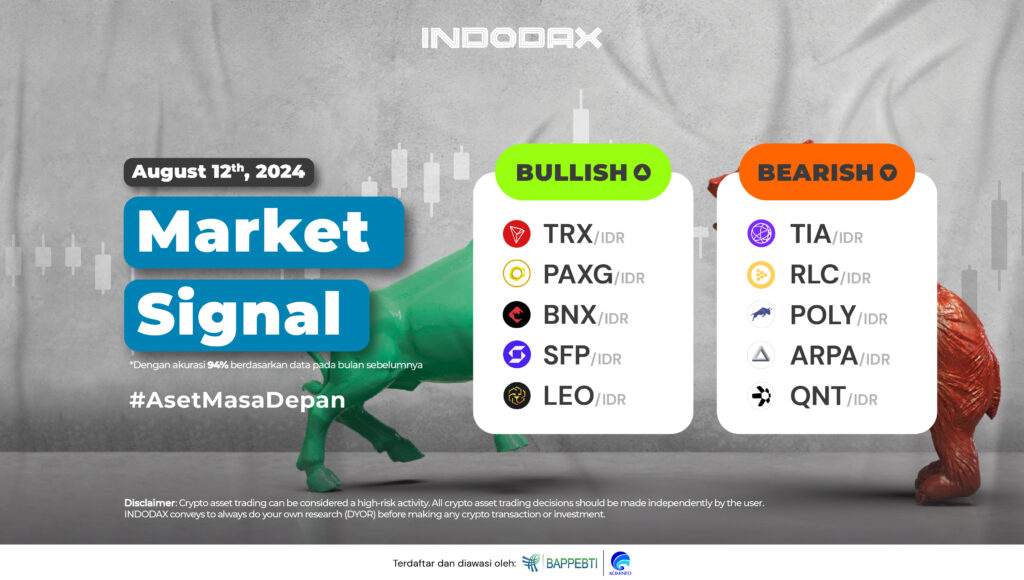
5 Bullish Crypto Assets
1. Tron (TRX)

Tron (TRX) is still indicated to be on a Bullish Trend, if you look at the 1-Day chart, it can be seen that on several occasions a long axis was formed, both positive and negative axes on the candle, indicating that the price change of Tron (TRX) is very high. Negative pressure will weigh on Tron (TRX) if strong support in the range of 1,700 – 1,850 can be broken.
2. Pax Gold (PAXG)

Had weakened and moved below the WMA/85 but the price moved back up and was held by the WMA/75 line. The bullish trend will be stronger to continue if a candle is formed with a complete shape above the 40,000,000 – 44,000,000 area.
3. BinaryX (BNX)

Touching the price of 18,000,000 made BinaryX (BNX) able to make its highest price since it was traded on Indodax. The candle is held by the WMA / 85, but still indicated to be in the Bullish phase, with the nearest Resistance area in the 6,500,000 – 8,500,000 area.
4. SafePal (SFP)

The 1-day chart indicates that SafePal (SFP) is still able to hold above the EMA/200 and the candle did not form below the support of 9,000 – 11,000 so the Uptrend phase is still formed. Time is needed to see the direction of the trend movement on the MACD indicator, but resistance is available in the range of 16,000 – 18,500.
5. Unus Sed Leo (LEO)

The trend movement of Unus Sed Leo (LEO) on the 1-Day time frame, still moving above the EMA/200, the opportunity for the trend to move positively is quite wide open. The trend indicated by the MACD indicator is experiencing Sideways, if it weakens it will test the strength of the 70,000 – 80,000 area.
5 Bearish Crypto Assets
1. Celestia (TIA)

Had managed to be in the Bullish phase but the Candle could not form above the price of 200,000 making Celestia (TIA) move back in the Bearish trend, causing the price to weaken more than 30%. Trend is indicated to be in a negative direction, but will try to test the area around 75,000 – 85,000.
2. iExec RLC (RLC)

One of the indicators used, RSI, indicates that the current trend may move away from the Overbought area, requiring confirmation to determine the trend movement. The 30,000 – 40,000 area is quite crucial for iExec RLC (RLC), if penetrated the opportunity to pass the EMA/200 becomes quite large.
3. Polymath (POLY)

Since the trend was in the Bullish phase on February 14, 2024, the negative impact on Polymath (POLY) price change has weakened by more than 50%. A price that can cross the 1,600 – 2,000 Resistance will be able to make the trend improve.
4. ARPA (ARPA)

The current trend is still on negative momentum, the trend cannot move above the WMA/85 so that it has an impact on the MACD indicator line which does not provide positive movement. WMA/85 will be positively broken, if the candle can break the 900 – 1,050 area.
5. Quant (QNT)

Since being in the Bearish trend, the price of Quant (QNT) has continued to decline quite deeply, since May 24, 2024 Quant (QNT) has weakened by around 30%. The weakening that occurred has given an indication on the RSI indicator if the price has touched the Oversold zone, with the nearest Resistance at 1,200,000 – 1,400,000.
NOTES:
If the EMA 5, crosses the WMA 75, 85 and EMA 200 lines, and the lines intersect from bottom to top, then the market trend is upward (bullish).
Each table above shows that if, the value of EMA 5 is higher than WMA 75, 85 and EMA 200, then the market is trending up (bullish).
If the RSI and MACD values show the same condition, it means that the market is showing the same trend, overbought (overbought), or oversold (oversold) conditions are one indicator that the market is at the point of changing the direction of the trend.
 Market