
Bitcoin continues to strengthen in its first week in early January 2021. It is again a bullish crypto-asset this week. Indodax.Academy predicts, that apart from Bitcoin there are several other crypto assets that experience bullish or increases in price.
From Sunday night, January 10th, 2021, to Monday, Bitcoin went down a little. This has also led to a decline in several other crypto assets. Altcoin prices also tend to follow Bitcoin’s prices.
However, this decrease was only temporary. After that, Bitcoin is predicted to increase again.
Bitcoin derivative forks such as Litecoin (LTC) and Bitcoin Cash (BCH) also experienced price increases. Likewise, the Ethereum (ETH) crypto asset is also bullish.
Actually, from the results of Indodax.Academy’s research, crypto assets on Indodax on January 11 – January 17, 2021 were mostly bullish. There are only a few crypto assets that are experiencing a decline in price or are bearish.
Meanwhile, DOGE, which is currently being discussed, is no longer a bullish crypto asset. This is because DOGE is experiencing market saturation. However, there is a potential for DOGE to rise slightly.
On the other hand, crypto assets that have decreased are crypto assets that have adopted the US dollar (USD). The weakening of the US dollar still occurs due to the weakening of the United States economy due to the COVID-19 pandemic and polemic factors regarding the Presidential Election.
Here is a complete explanation of the 5 crypto assets that are bullish and bearish for the next week.
5 Bullish Crypto Assets This Week
- Bitcoin (BTC)
Bitcoin will maintain its rally for the next week. Bitcoin has again become a bullish crypto asset over the last few months.
The demand for Bitcoin tends to increase massively. Although there is a slight decline in prices, because the market is saturated every now and then. The increase in Bitcoin is predicted to still occur in 2021. Many analysts at Bloomberg believe that the increase in Bitcoin could even double this year.

Chart Bitcoin/IDR
In today’s trading, BTC moved at the lowest level of IDR554,374,000 and the highest level was IDR580,371,000
Here’s BTC’s technical analysis this week:
| EMA 5 | 547,239,147 | buy |
| WMA 75 | 349,245,354 | buy |
| WMA 85 | 336,861,558 | buy |
| EMA 200 | 239,811,976 | buy |
| RSI (15) | 86.6526 | overbought |
| MACD 12,26 | 66741413.61 | Buy |
| Summary | BUY (5) Overbought (1) | |
| bullish |
- Ethereum (ETH)
Ethereum is back in a bullish crypto asset. ETH passed its historical high last week.
Even though it fell slightly on Monday morning, Ethereum is still predicted to increase during 11 January-17 January 2021.
This crypto asset is still bullish due to the high reduction in Ethereum supply. In phase 0 in stages, the Ethereum limit is reduced by millions of dollars.

Chart ETH/IDR
In today’s trading, ETH moved at the lowest level of IDR 17,000,000 and the highest level was IDR 18,999,000. ETH entered into 5 bullish crypto assets this week.
Here’s the ETH technical analysis for this week:
| action | ||
| EMA 5 | 17,319,919 | buy |
| WMA 75 | 10,160,370 | buy |
| WMA 85 | 9,804,505 | buy |
| EMA 200 | 7,050,022 | buy |
| RSI (15) | 91.0561 | overbought |
| MACD 12,26 | 2448297.535 | buy |
| Summary | BUY (5) overbought (1) | |
| bullish |
- NEO
NEO is a crypto asset that will be bullish this week. The increase in NEO was due to the high demand on its platform.
NEO has the same business model as the Ethereum Foundation, which is to provide a network to generate new crypto assets. Ethereum is subject to frequent bugs and high transaction fees, plus the Ethereum price has doubled in the last week.
The problems that occurred with Ethereum made people switch to other networks, one of which was NEO. The increased demand also makes the price of NEO increase.

Chart NEO/IDR
In today’s trading, NEO moved at the lowest level at IDR288,400 and the highest level at IDR334,800. NEO is among the top 5 crypto assets that are bullish this week.
Here’s this week’s NEO technical analysis:
| 287,322 | buy | |
| WMA 75 | 240,339 | buy |
| WMA 85 | 239,794 | buy |
| EMA 200 | 229,043 | buy |
| RSI (15) | 72.9566 | buy |
| MACD 12,26 | 14846.6274 | buy |
| Summary | BUY | |
| bullish |
- Litecoin (LTC)
Litecoin (LTC) is again a crypto asset that experienced a price increase this week. Apparently, the increase in BTC was also followed by an increase in the price of the fork down like this LTC. You can see, the chart is almost similar to BTC.
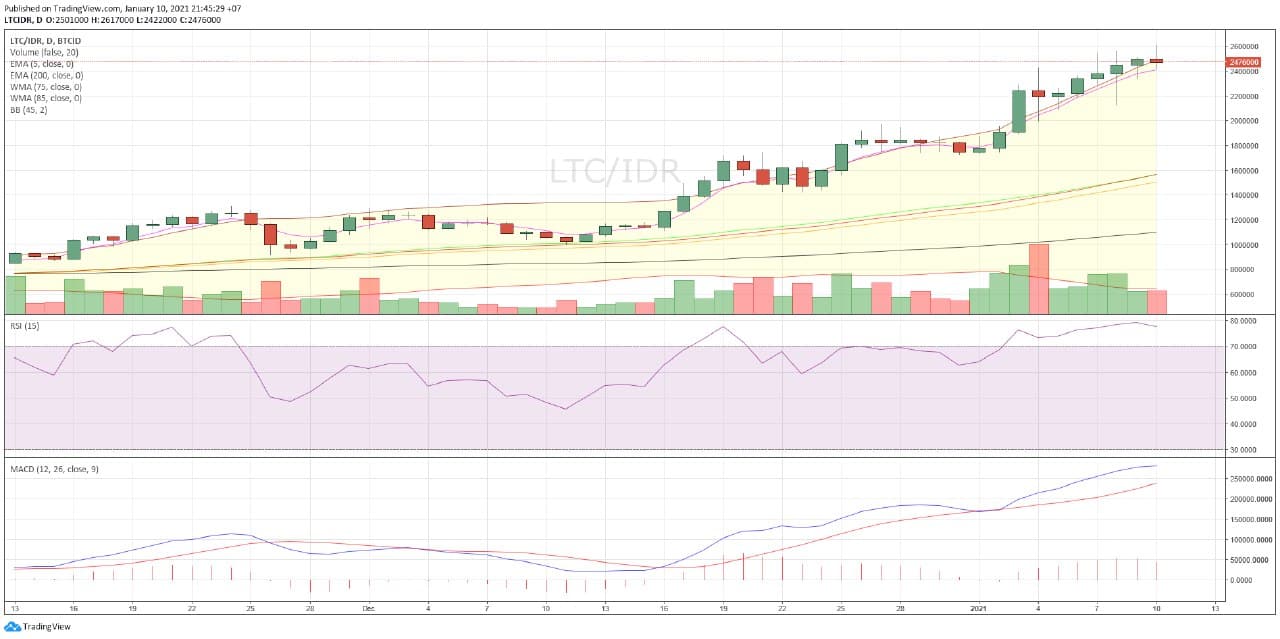
Chart LTC/IDR
On today’s trading, LTC moved at the lowest level of IDR2,370,000 and the highest level was IDR2,817,000. LTC entered into 5 bullish crypto assets this week.
Here’s LTC’s technical analysis for this week.
| action | ||
| EMA 5 | 2,411,394 | buy |
| WMA 75 | 1,565,769 | buy |
| WMA 85 | 1,503,951 | buy |
| EMA 200 | 1,100,246 | buy |
| RSI (15) | 77.6249 | overbought |
| MACD 12,26 | 282197.9415 | buy |
| Summary | BUY (5) overbought (1) | |
| bullish |
- Bitcoin Cash (BCH)
Bitcoin Cash (BCH) is the most popular Bitcoin derivative crypto asset. BCH is back in the crypto assets which will be bullish this week.
BCH is a crypto asset that is often used as a means of payment. As the price of Bitcoin continues to increase, BCH is taking a small presentation for currency exchange, making it easier to exchange.
Just like BTC and ETH, BCH is also overbought this week.
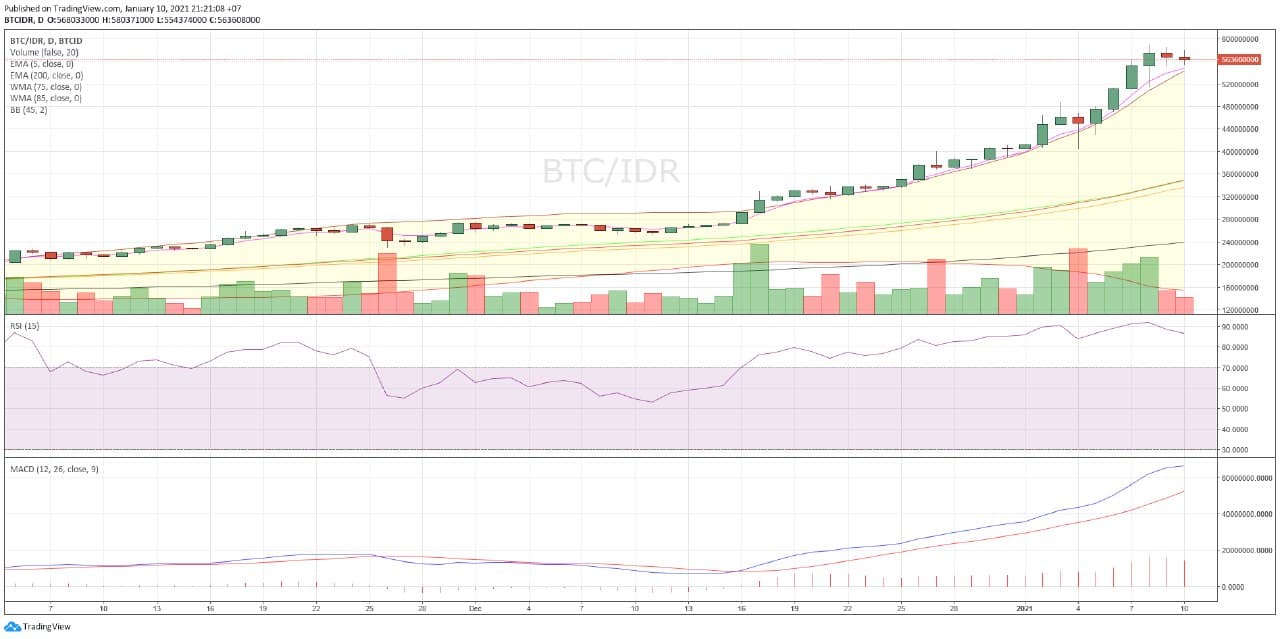
Chart BCH/IDR
In today’s trading, BCH was moving at the lowest level of IDR 6,308,000 and the highest level of IDR 6,954,000. BCH has entered into 5 bullish crypto assets this week.
Here’s the BCH technical analysis for this week:
| action | ||
| EMA 5 | 7,340,619 | buy |
| WMA 75 | 4,731,603 | buy |
| WMA 85 | 4,636,815 | buy |
| EMA 200 | 4,177,697 | buy |
| RSI (15) | 82.4158 | overbought |
| MACD 12,26 | 830057.2118 | buy |
| Summary | buy (5) overbought (1) | |
| bullish |
5 Bearish Crypto Assets This Week
- Tether (USDT)
Tether (USDT) continues to decline. This seems to describe the US economy which continues to experience weakness after the 2020 Presidential Election. In fact, previously, the US economy also weakened due to the pandemic.
USDT is a 1:1 stablecoin with US dollars (USD). USDT is the most favorite stablecoin crypto asset and is the 3rd favorite crypto asset after Bitcoin and Ethereum.
This is because many people use USDT as a means of payment. Compared to Bitcoin and Ethereum, this stablecoin is easier to use as a medium of exchange because it follows the dollar price.
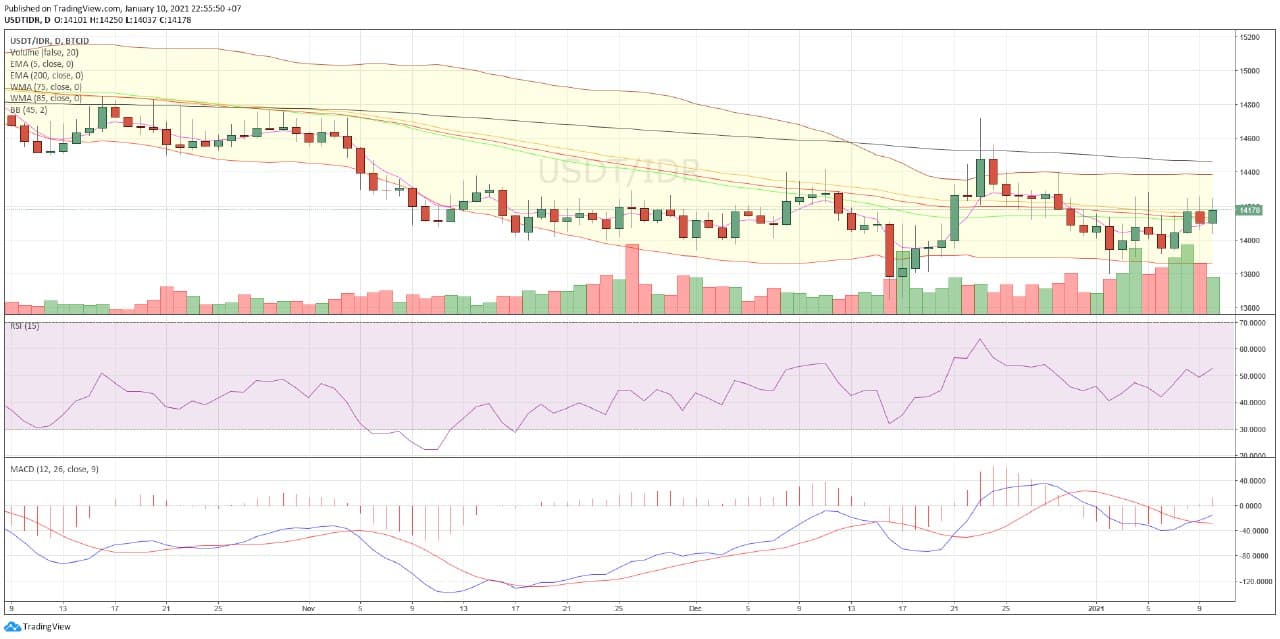
Chart USDT/IDR
In today’s trading, USDT moved at the lowest level of IDR14,070 and the highest level was IDR14,250.
| action | ||
| EMA 5 | 14,115 | sell |
| WMA 75 | 14,135 | sell |
| WMA 85 | 14,154 | sell |
| EMA 200 | 14,461 | sell |
| RSI (15) | 52.6667 | buy |
| MACD 12,26 | -15.0449 | oversold |
| Summary | SELL(4) BUY(1) oversold(1) | |
| bearish |
- Ripple (XRP)
Ripple (XRP) is still experiencing price weakness. There are still many brokers delisting XRP. This is because this crypto asset is suspected of fraudulent transactions.
Ripple Labs, the XRP company, was sued by the SEC (Security and Exchanges Commission) or the United States Securities and Exchange Commission.
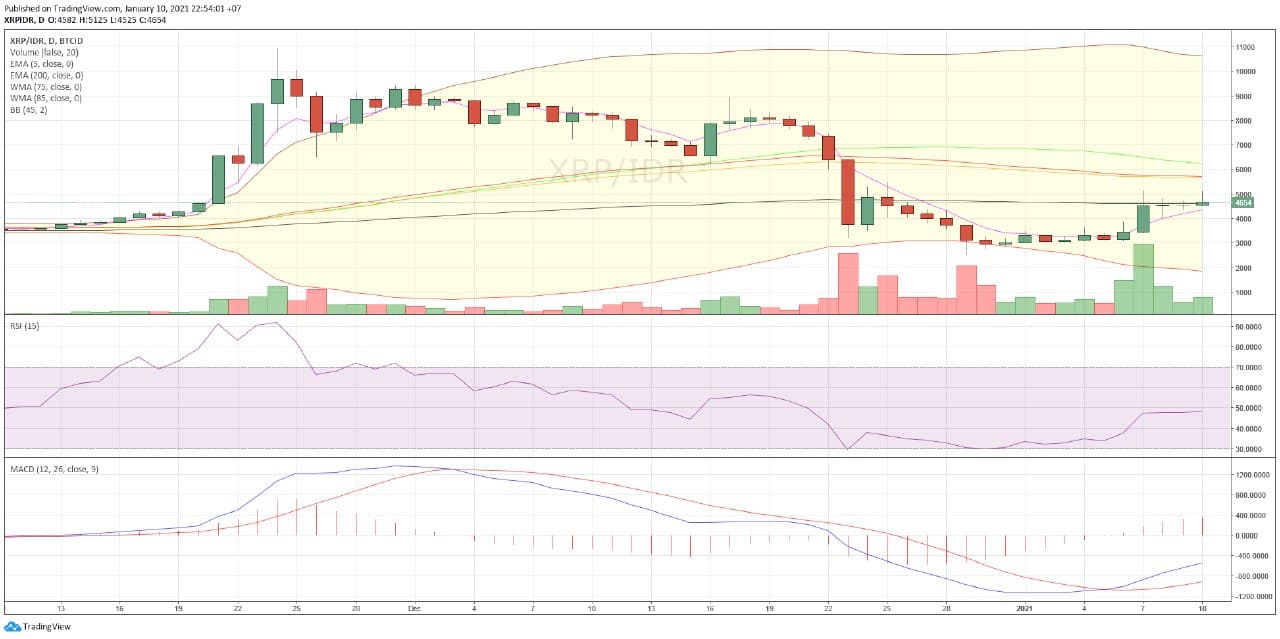
Chart XRP/IDR
In mid-year trading, XRP moved at the lowest level of IDR 4466 and the highest level of IDR 5125.
Here’s the XRP technical analysis for this week:
| action | ||
| EMA 5 | 4,351 | sell |
| WMA 75 | 5,699 | sell |
| WMA 85 | 5,644 | sell |
| EMA 200 | 4,600 | sell |
| RSI (15) | 45.5894 | neutral |
| MACD 12,26 | -545.4433 | oversold |
| Summary | SELL (4) NEUTRAL (1) OVERSOLD (1) | |
| bearish |
- DAD
DAD is a crypto asset that is experiencing a downward trend. DAD is a crypto asset that is engaged in an advertising company. Unfortunately, DAD’s innovation has not gone well, so the price has decreased this week.

Chart DAD/IDR
In today’s trade, DAD moved at the lowest level of IDR2051 and the highest level of IDR2153
The following is DAD’s technical analysis for this week:
| action | ||
| EMA 5 | 2,068 | sell |
| WMA 75 | 2,414 | sell |
| WMA 85 | 2,426 | sell |
| EMA 200 | 3,061 | sell |
| RSI (15) | 42.1078 | neutral |
| MACD 12,26 | -132.3643 | oversold |
| Summary | SELL (4) NEUTRAL(1) OVERSOLD(1) | |
| bearish |
- VIDY
Vidycoin (VIDY) is bearish this week. This crypto asset is actually not that popular compared to other crypto assets. Although in fact, there are also many crypto asset communities in Indonesia.
It’s just that, Vidy experienced a decline in price because the market was saturated. It could also be, due to a lack of innovation that has not yet become a price increase.

Chart VIDY/IDR
In today’s trade, the lowest price of DASH is at the level of Rp14 and the highest price is Rp15.
Here’s VIDY’s technical analysis for this week:
| action | ||
| EMA 5 | 14.59 | sell |
| WMA 75 | 14.59 | sell |
| WMA 85 | 14.55 | sell |
| EMA 200 | 15.70 | sell |
| RSI (15) | 45.3122 | sell |
| MACD 12,26 | -0.1048 | sell |
| Summary | SELL | |
| bearish |
- USD Coin (USDC)
USD Coin or USDC is a stablecoin crypto asset derived from the US dollar (USD). Similar to USDT or Tether, the decline in price occurred due to the weakening of the US dollar.

Chart USDC/IDR
In today’s trading, USDC moved at the lowest level of IDR14,000 and the highest level was IDR14,172.
Here’s the USDC technical analysis for this week:
| action | ||
| EMA 5 | 14,054 | sell |
| WMA 75 | 14,124 | sell |
| WMA 85 | 14,146 | sell |
| EMA 200 | 14,452 | sell |
| RSI (15) | 49.7836 | neutral |
| MACD 12,26 | -30.65 | oversold |
| Summary | SELL (4) neutral (1) oversold (1) | |
| bearish |
NOTE: If the EMA 5 crosses the WMA 75, 85 and 200 EMA and these lines intersect from bottom to top, the market trend tends to go up (bullish),
In each table above, it shows that if the value of EMA 5 is higher than WMA 75.85 and EMA 200 then the market tends to rise (bullish).
If the RSI and MACD values ??show the same condition, it means that the market is showing the same trend, overbought condition or oversold condition is an indicator that the market is at a point of changing the trend direction.
ATTENTION: All content which includes text, analysis, predictions, images in the form of graphics and charts, as well as news contained on this website, is only used as trading information only, and does not constitute a suggestion or suggestion to take an action in a transaction whether to buy or sell certain crypto assets. All crypto asset trading decisions are independent decisions by the user. Therefore, all risks arising from it, whether it is profit or loss, are not the responsibility of Indodax.
 Market

