In trading stocks and crypto assets, technical analysis is an important method to understand.
This is because technical analysis analyzes price movements and trading volume.
Technical analysis also consists of various chart models and patterns, one of which is quite popularly used is the candlestick pattern.
It should be noted that candlestick patterns are a technical analysis tool used to identify graphic patterns formed by candlesticks on price charts.
The candlestick pattern is also divided into several types, one of which is the shooting star candle.
This pattern will determine the bearish reversal mode, and its presence helps traders to be able to analyze the current conditions.
So, to better understand the shooting star candle pattern, how to read it, and tips on using it, see the full review below.
Get to know the Shooting Star Candle

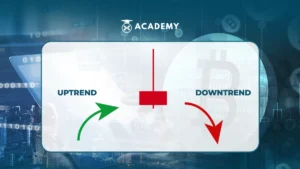
The definition of the shooting star candle pattern is a candlestick pattern that is bearish and usually appears near the highest price peak in an uptrend that has occurred until then.
The presence of this shooting star candle pattern can signal a change from an uptrend to a downtrend, both in the short and long term.
Furthermore, this candlestick pattern is often seen as a signal of a trend reversal or at least a potential price reduction in the future.
A number of main components make up a shooting star candlestick pattern, including a long upper wick and a small body at the bottom.
The long upper wick (upper shadow or upper wick) is the most important characteristic of the shooting star candle pattern.
The long upper wick represents the highest price range reached during that period.
In this type of pattern, the long upper wick indicates that the buyers initially pushed the price up to a new high, but then sellers came in and controlled the price movement, pushing the price back down near the opening price.
Meanwhile, the small body (body) at the bottom, located at the bottom of the shooting star pattern, shows the opening and closing prices tend to be close.
It’s important to note that the small body indicates that the buying and selling pressures were fairly balanced over that period.
Why is the Shooting Star Candle Important?
In technical analysis, the shooting star pattern is often considered important because this pattern can indicate a price reversal or trend change.
This can happen because the shooting star pattern will form when the price goes up first during the trading session but then reverses down and closes near the opening price.
This illustrates that selling pressure is starting to increase and overpowers the previous buying pressure.
It should be underlined this change also indicates that buyers are losing control and sellers are starting to take over.
Besides that, the shooting star pattern often indicates a trend reversal or at least a price correction that has the potential to occur.
If this pattern forms at the top of an uptrend, then it can signal that the uptrend will reverse into a downtrend.
This pattern can also be created during a downtrend and indicates the possibility of an upward correction in the current trend.
Furthermore, the shooting star candles pattern shows strong selling and weak buying pressure.
Strong selling pressure occurs because the shooting star pattern forms when the price goes up first, reversing down and closing near the opening price.
Meanwhile, the buying pressure is weakening because the long upper wick shows that the price has reached a new high or a significant resistance level in this pattern.
However, even if the price hits this level, the close price is close to or even below the open price.
How to Read Shooting Star Candle
After knowing the importance of the shooting star candle pattern, it is also important to understand how to read it.
Understanding this will be the key to effectively using the shooting star candle pattern in technical analysis.
In addition, understanding how to read it will allow traders to recognize potential price reversal signals or trend changes.
It should be understood that when reading this candle pattern, it is important to know when this candlestick is present.
The shooting star pattern will only form at the end of an uptrend. Therefore, it doesn’t mean anything if it forms in the middle of a trend or downtrend.
Then, you also need a confirmation candle which will help the shooting star be more accurate.
The supporting factors themselves can be seen from two conditions. The first is the shooting star candle pattern, after three consecutive bullish candles with higher highs.
The second condition is the presence of the next candle, which has an opening price close to the closing price of the shooting star candle but then moves further down.
Also, the candle must have a high and closing price below the shooting star candle pattern.
With this confirmation candle, you can be sure that the price movement will be in a trend reversal and continue to decline in the next session.
Advantages and Disadvantages of Shooting Star Candles
After understanding how to read it, now is the time to find out the advantages and disadvantages of this candle pattern.
Understanding the advantages and disadvantages of shooting star candle patterns will help traders regarding their use in technical analysis.
Later, with this in mind, it is hoped that traders can make better trading decisions.
The following are some of the advantages or advantages of shooting star candles, including:
-
Easy identification
The first advantage of this pattern lies in its easy identification. This can happen because this pattern is a single candlestick.
Therefore, traders only need to find a candle with a small body with a very long upper wick and at the end of an uptrend.
-
Suitable for beginners
Because it is easy to identify, the shooting star candle pattern is considered very suitable for novice traders.
However, many professional traders also use this one indicator when they want to find confirmation of a trend reversal.
Meanwhile, the disadvantages of shooting stars are as follows:
-
Additional indicators are required.
The drawback of this one pattern is that additional indicators are needed to ensure a trend reversal occurs.
In this case, the shooting star candle pattern must be followed by a confirmation candle. A confirmation candle cannot ensure that a trend reversal to a downtrend will occur in the long or short term.
Therefore, it is important for traders also to use other analyses, including moving averages and candlestick patterns.
Tips for Using Shooting Star Candles

To use the shooting star candle shooting star pattern as a signal for trading decision-making, there are tips that traders need to know.
As for the tips, namely by ensuring a confirmation candle, in this case, when a candle with a lower body and high appears, it means that the shooting star pattern has been confirmed.
If a trader wants to go long, it is recommended to refrain from entering first because there is a possibility that the asset will experience a trend reversal and be corrected.
On the other hand, traders who already have positions can take profit or cut losses to minimize the high risk of loss.
Furthermore, if a trader wishes to place short, then the presence of a confirmed shooting star can be considered as a potential entry point.
This is because asset prices will experience a downtrend. However, traders are also advised to consider other factors, including the overall trend, support points, volume, and resistance, when wanting to go short.
The difference between Shooting Star Candle and Inverted Hammer
Understanding the difference between the shooting star candle pattern and the inverted hammer is also important.
The reason is there are indeed key differences that must be considered even though these two patterns, at first glance, look similar.
This understanding will later enable traders to recognize and interpret this candle pattern more accurately.
It should be noted that many novice traders think that a shooting star is an inverted hammer and vice versa.
This happens because these two candle patterns have a very long upper wick with a small body.
Not only that, these two patterns also have very short or nonexistent lower wicks.
In reality, each pattern has significant differences and is easily recognizable.
The main difference, namely in the location of the formation of these two candles. Related to that, a shooting star candle will form at the end or near the end of an uptrend.
On the other hand, the inverted hammer candle pattern will form at the end or near the end of a downtrend.
Apart from the different formation places, the signals given by each of these candle patterns are also known to be different.
The shooting star can be identified as a marker of a change from an uptrend to a downtrend, while the inverted candle hammer can be identified as a marker of a change from a downtrend to an uptrend.
Conclusion
The definition of the shooting star candle pattern is a candlestick pattern that is bearish and usually appears near the highest price peak in an uptrend that has occurred until then.
The presence of this shooting star candle pattern can signal a change from an uptrend to a downtrend, both in the short and long term.
In technical analysis, the shooting star pattern is often considered important because this pattern can indicate a price reversal or trend change.
This can happen because the shooting star pattern will form when the price increases during the trading session, then reverse down and close near the opening price.
This illustrates that selling pressure is starting to increase and overpowers the previous buying pressure.
So, that was the complete discussion about shooting star candles, from understanding how to read to the differences. Furthermore, you can also read other interesting articles, such as candlestick reversal patterns to various complete chart patterns to increase profits when trading only at INDODAX Academy.


 Polkadot 9.78%
 BNB 0.37%
 Solana 5.77%
 Ethereum 1.84%
 Cardano 1.53%
 Polygon Ecosystem Token 2.91%
 Market


