In trading, a trader needs the ability to analyze the price movements of an asset using technical analysis.
In this case, one of the tools that can help traders carry out technical analysis is TradingView.
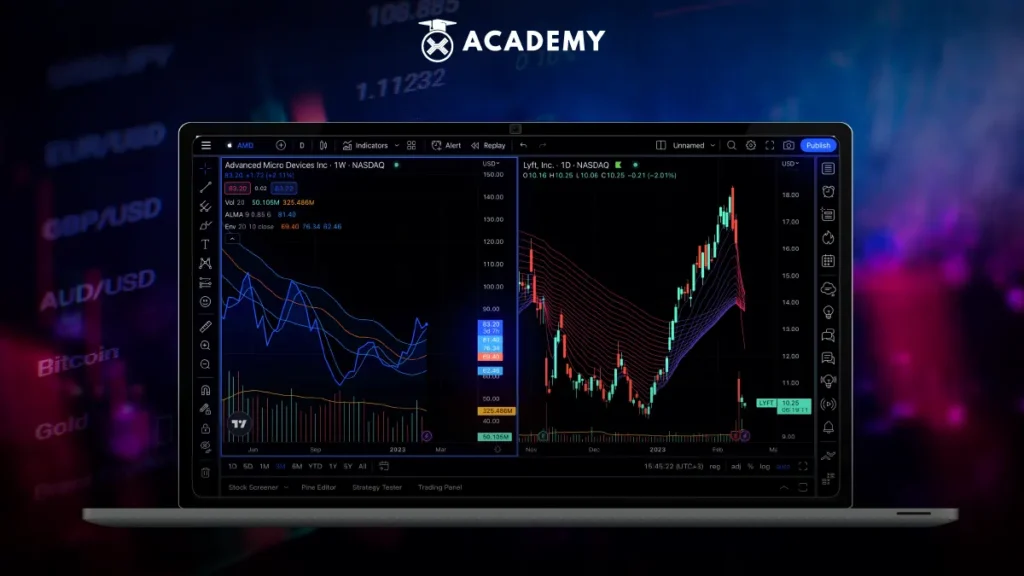
TradingView itself is a charting and technical analysis platform that is very popularly used by traders and investors all over the world.
TradingView is a powerful tool that helps users understand financial market price movements, perform technical analysis, and make trading decisions based on accurate market data.
This tool is a top choice for traders and investors, among other things, because it offers interactive charts that allow users to draw trend lines, add technical indicators, and perform analysis directly within the charts, making it easier to understand price movements and market trends.
In addition, this platform is equipped with a variety of technical indicators and analysis tools, such as moving averages, Bollinger Bands, MACD, and others. Users can customize indicator settings and use them to identify trading opportunities.
So, to understand more about what TradingView is, its functions and features, how to use it, and its advantages and disadvantages, see the following review.
What is TradingView?

Basically, TradingView is a software platform specifically designed for financial market analysis and trading. This tool is used by traders and investors to observe price movements, perform technical and fundamental analysis, and develop trading strategies.
TradingView is important for traders because it provides a number of key benefits that support their trading activities.
One of them is because TradingView provides a variety of technical and fundamental analysis tools that help traders identify trading opportunities and plan their strategies. It includes interactive charts, technical indicators, trendline tools, chart patterns, and more.
In addition, the platform also provides access to real-time financial market data, including stock prices, cryptocurrencies, indices, commodities, and more.
Real-time data is essential for traders who need to make trading decisions based on current price movements.
Get to Know TradingView Functions
Getting to know the TradingView function is very important for traders and investors because it will help in analyzing price movements and using technical indicators.
Therefore, getting to know TradingView’s functions well helps traders and investors make better decisions, optimize trading strategies, and utilize the various analytical tools provided.
The following are several TradingView functions for traders:
-
Helps Open Positions when Trading
Finding the optimal entry point in trading is very important because it will affect your future investment results.
-
Helps Stop Loss when Trading
Determining a stop-loss level that suits your risk tolerance is key to managing investment risk.
-
Helps Identify Trends
Understanding the long-term trend of each asset you buy helps to avoid investing in companies that experience declines over long periods of time.
TradingView Features
TradingView is a platform that offers a number of interesting features for traders. In fact, getting to know TradingView’s features is very important because these features help traders and investors carry out market analysis, manage portfolios, and make better trading decisions.
The following are various important features available on TradingView:
-
Interactive graphic display
TradingView provides an interactive chart display so traders can analyze price movements easily. In this chart view, you can select different time frames, draw trend lines, add graphic objects such as horizontal patterns, and perform technical analysis directly within the chart.
-
Complete collection of technical indicators
The platform has a comprehensive collection of technical indicators that includes more than 100 different indicators. These include indicators such as moving averages, Relative Strength Index (RSI), Moving Average Convergence Divergence (MACD), Bollinger Bands, and more. You can adjust the indicator settings according to your preferences.
-
Social community
TradingView has a community feature that allows traders to interact, share analysis, and discuss trading ideas with other traders. You can follow other traders, like, comment, and participate in discussion forums. This will open up opportunities to learn from the experiences and perspectives of other traders.
-
Useful alerts and notifications
You can set price alerts and notifications in TradingView. It allows users to receive notifications when prices reach certain specified levels, so you don’t have to constantly monitor the market. These alerts are very useful for identifying trading opportunities or managing risk.
-
Support for various types of markets
TradingView supports various types of financial markets, including stocks, crypto assets, indices, commodities, bonds, and more. You can easily access data and charts for these instruments, and the platform also provides real-time market data for most markets.
How to Use Tradingview for Beginners?

TradingView features are very important to know. The reason is, these features will help traders and investors carry out market analysis, manage portfolios, and make the right trading decisions. The following is a step-by-step tutorial on how to use TradingView for beginner traders that you need to know, including:
-
Create an account and log in
- Go to the TradingView website at https://www.tradingview.com
- Click the “Join for free” or “Register for free” button to create a new account.
- You can register using your email address or social media account such as Google or Facebook.
- Fill in the information required to create an account, including username and password.
- After registering, verify your email address by following the verification link sent by TradingView.
- Once your account is verified, log in using the username and password you created.
-
Browse the price chart
- After logging in, you will see the main dashboard. Here, you can search for the financial instrument (e.g., shares, crypto assets, indices) that you want to analyze.
- Once you select an instrument, a price chart will appear on the screen.
- You can set the chart time frame, change the time interval (for example, from daily to 1 hour), and zoom in or out on the chart to see more detailed price movements.
-
Using technical indicators
- At the top of the chart, you will find the “Indicators” button. Click this button to add technical indicators.
- Select the indicator you want to use from the list provided. You can also search for a specific indicator by typing it in the search field.
- After selecting an indicator, you can customize its settings, such as period or color.
Indicators will appear on your price chart, providing signals or additional information about price movements and trends.
-
Interact with the community
- At the bottom of the screen, you will see the “Ideas” and “Scripts” tabs. This is a place where other traders share their analysis and trading ideas.
- You can click on the “Ideas” tab to view trading ideas from other traders. You can also follow traders that you are interested in.
- Under each idea, you can see comments from the community. You can participate in discussions by commenting on ideas or giving likes.
- If you want to share your own analysis or trading ideas, you can click the “Publish idea” button and follow the guidance provided.
Advantages and Disadvantages of Tradingview
Knowing how to use TradingView for beginners is very important because this platform is a powerful tool that can help beginners understand the markets and plan trades better.
The following are various advantages and disadvantages of Tradingview that beginner traders need to know, namely:
The advantages
One of TradingView’s strong points is its wide selection of plans. TradingView offers various subscription levels, including a free version with basic features, as well as paid plans with additional features.
This gives traders the flexibility to choose a package that suits their needs and budget. Paid plans often provide access to more advanced features, such as additional technical indicators and advanced market data.
In addition, interactive charts in TradingView allow traders to perform in-depth technical analysis.
This includes the ability to customize time frames, add indicators, and draw trendlines. Interactive charts help traders make more informed trading decisions.
TradingView also provides more than 100 different technical indicators. It includes popular indicators such as moving average, RSI, and MACD. This extensive collection of indicators helps traders in identifying trading opportunities and analyzing the market with various approaches.
This platform provides highly accurate real-time market data. Real-time data is key for traders who want to make decisions based on the most recent price movements.
This data is available for a variety of financial instruments, including stocks, cryptocurrencies, indices and commodities.
Furthermore, many leading online brokers have integrated with TradingView. This allows traders to trade directly from the TradingView platform so that trade execution is faster and more efficient. This integration also allows easy access to portfolio and trading history.
The downside
Meanwhile, one of the main drawbacks of TradingView is that some of the best features are only available in paid plans. This can certainly be an obstacle for novice traders who want to access all TradingView features.
Conclusion
In addition, the presence of an active social community on TradingView can trigger the effect of FOMO (Fear of Missing Out) or FUD (Fear, Uncertainty, Doubt).
New traders may be tempted to follow trading ideas from other traders without sufficient understanding, which may result in losses.
Come on, make an easy, safe and profitable crypto investment at Indodax
So, now you understand what TradingView is, its functions, features, how to use it, and its advantages and disadvantages.
Next, after you understand and understand how to use tradingview, now is the time to start investing in crypto at INDODAX.
The method is first, you need to download the INDODAX application first then register and log in to your Indodax account.
Then, you can verify your account before you can make deposits and trade crypto on INDODAX. If the account has been verified, next you need to deposit funds into your INDODAX account, then choose the crypto you want to trade.
After selecting the crypto you want to trade, you can open a trade, namely by determining the buy/sell price according to your preferences or by using the current market price.
It’s easy, right? Come on, start investing in crypto immediately at INDODAX!
 Market