Crypto traders often use many strategies, one of which is the triple bottom pattern.
The triple bottom pattern is a type of chart pattern that is important to know.
So, to get to know the triple bottom pattern and the appropriate strategy, let’s see the full review below.
What is the Triple Bottom Pattern

The triple bottom pattern is a bullish reversal pattern consisting of three consecutive bottoms and neckline resistance and appears after a downtrend.
The shape of this pattern is like the letter W twice. This is because the triple bottom produces a trend change to the upside through interruptions of a downward price trend.
Typically, this pattern which is the significant reversal, will be created in 3 to 6 months.
This pattern is the same as other reversal patterns, such as the double bottom and the head and shoulders pattern.
Therefore, like any other reversal pattern, this case must have a downtrend or precedent.
The shape of the triple bottom pattern is three peaks below the resistance level or neckline.
Meanwhile, the first peak appears after a strong downtrend, then retraces to the neckline.
The triple bottom has finished forming when the price moves back to the neckline after forming the third peak.
The bullish trend reversal can be confirmed when the price breaks the neckline/resistance level after forming three tops.
Meanwhile, the emergence of this pattern indicates that the trend position can be a buying momentum.
This is because the trend position in the triple bottom pattern has reached the lowest price, and after that, it is predicted that an increase/bull market will occur.
Characteristics of the Triple Bottom Pattern
Meanwhile, the characteristic of the triple bottom pattern is that there are three failed attempts by sellers to push the price to the support level, which are accompanied by a decrease in volume.
However, unlike the triple-top pattern, this failure sent the asset price beyond the resistance level.
In this triple bottom pattern, buyers are in a winning position, which makes the price trend up (bullish).
How to Read the Triple Bottom Pattern
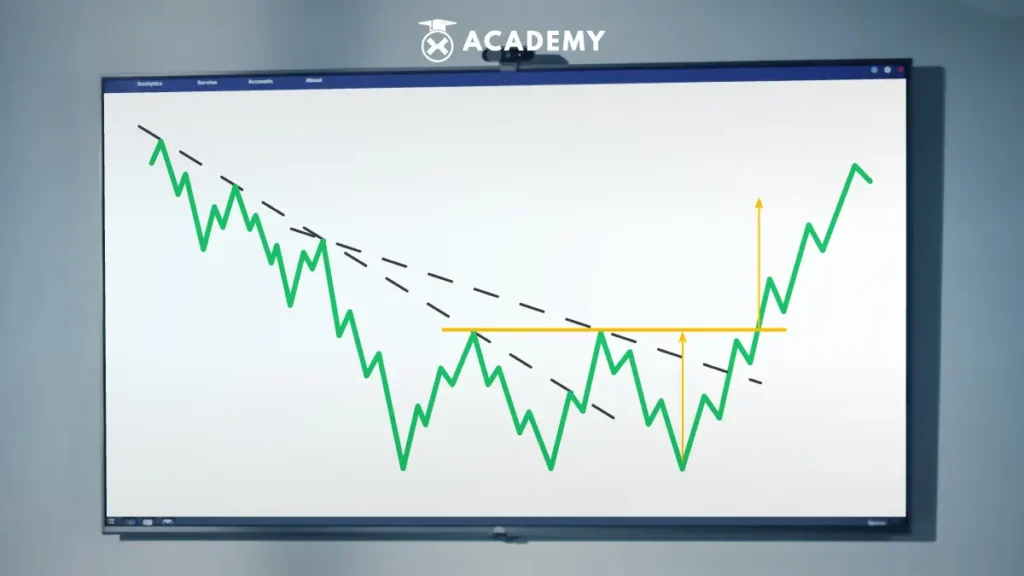
Regarding how to read the triple bottom pattern chart pattern, let’s first look at the following sample images:

From the picture above, there are two phases in the triple bottom pattern, which are as follows:
1. The phase of forming twice the letter W
As shown by number 1, the price moves to the point or lowest position until it reaches the support level.
Then, there were two attempts by sellers to push the price to the resistance level, but they failed. Then, in the end, the price still fell to the support position.
As illustrated in the positions of numbers 3 and 5, this condition also occurs successively.
The numbers 1, 3, and 5 are called the triple bottom pattern.
2. Bullish phase
Furthermore, the trading chart will exceed the resistance level position.
This is called the bullish phase and usually confirms that the triple bottom pattern is indeed formed and not a misinterpretation.
Forming Aspects of the Triple Bottom Pattern
The aspects that make up the triple bottom pattern consist of three, namely as follows:
1. Duration
Duration is the first aspect that forms the triple bottom pattern. It should be noted the movement of the trend is very fast, and in this case, everyone will buy/sell fast.
Meanwhile, traders will be influenced by unusual/sudden trend movements for a long duration in making decisions.
The reason is that traders need help determining whether to buy or sell.
On the other hand, a trend in a low position for a long duration will make it difficult for buyers to decide whether this is the right time to sell and whether the trend will continue to move down.
When traders decide to buy and try to push the trend to the resistance area, in the end, this trend can go in various directions, either down or up.
Later, from there, the triple bottom pattern can form before then experiencing bullish.
2. Volumes
Another aspect of the triple bottom pattern is the number of purchases, or trading volume traders make when the trend moves downwards.
Because the trend was downward, traders were buying in large volumes.
The condition when traders buy in large volumes can be called a breakout and form a triple bottom pattern.
3. Volatility
Finally, there is volatility which is also an aspect of forming the triple bottom pattern.
Volatility plays a role in measuring the variation in price trends over the entire period.
The volatility in this measurement will calculate the comparison between bearish or bullish, trying to push the price down or up, forming a triple bottom pattern.
Advantages and Disadvantages of the Triple Bottom Pattern
Below are several advantages and disadvantages of the triple bottom pattern that traders need to know, namely as follows:
1. Excess
- It’s easy to use
This pattern is easy for traders to identify and understand, so even novice traders can use this indicator.
- Able to show the occurrence of a reversal of direction
This chart pattern can be used as a signal indicating a trend reversal from a downtrend to an uptrend.
- It can be used as a reference for entry buy.
The triple bottom pattern can show a price reversal from bearish to bullish (bullish reversal), so when this pattern depicts a downtrend to an uptrend, it can be used as a reference for buy entries.
2. Lack
- It needs to be combined with other indicators
When used as a single reference, these patterns are difficult to produce accurate information. Therefore, this pattern must be used with other indicators, for example, the Moving Average (MA) and Relative Strength Index (RSI).
- Cannot be used as a reference for entry sell
The triple bottom pattern can only be used as a reference for buy entries because it shows a bullish reversal and cannot be used as a reference for sell entries.
How to Use the Triple Bottom Pattern
Regarding how to use the triple bottom pattern in trading, there are several strategies that traders must pay attention to, namely the following:
1. Entry-long position
Before opening a position, a trader must pay attention to the trading phases of the market.
This pattern is characterized by a downward price and trading volume trend and then ends with an upward trend.
In this case, traders may only enter a long position when the price has reached the resistance level or when an uptrend begins to trade and touches the resistance level in the bullish phase.
2. Determine the stop loss
It’s a good idea to stop loss is determined based on the last bottom peaks or the position of the last lowest level.
However, it is better to determine the stop loss by looking at other indicators, for example, the Fibonacci retracement level.
3. Target price
Ideally, the target price to aim for profit should be the same as the distance between the neckline and bottom peaks.
The neckline is the line that is the peak of resistance three times in a row and serves as a barrier between the downtrend and the uptrend in the bullish phase.
Example of the Triple Bottom Pattern
Regarding the triple bottom pattern example, two indicators can be combined, namely the MACD (Moving Average Convergence Divergence) indicator and Fibonacci retracement levels.
1. MACD (Moving Average Convergence Divergence)

The triple bottom pattern combined with the MACD indicator will result in a cross at the right level where prices breaking through the resistance line can be found more quickly.
Let’s look at the example graph above. There, MACD gets another signal for trend reversal.
As can be seen in the chart, the MACD (Moving Average Convergence Divergence) crossover occurs when the price reaches the resistance line, and it helps traders to confirm the trend reversal.
2. Fibonacci retracement levels

The Fibonacci retracement levels indicator can be a major support and resistance area.
The trading chart example above shows that the price is in the same position after failing to cross the resistance line three times.
Interestingly, the price breakout occurred on the Fibonacci 23.6%, which does serve the purpose of confirming the break.
This combination allows stop loss to be placed at the 0% Fibonacci level, while profit targets can be set at 50%.
Disclaimer Triple Bottom Pattern
There are several things to note when using the triple bottom pattern in trading.
- Given that this pattern was created at the end of a downtrend, the previous trend must be a downtrend.
- Traders must record all observations, especially when three rounding bottoms are seen.
- Long positions should only be entered when the price breaks the resistance/neckline level.
On the other hand, even though it is one of the favorite indicators often used by traders, the triple bottom pattern must align with understanding how to use it to get maximum profit.
Conclusion
In conclusion, the triple bottom pattern is a bullish reversal pattern consisting of three consecutive bases and neckline resistance and appears after a downtrend.
The shape of this pattern is like twice the letter W. That’s because the triple bottom produces a trend change to the upside through interruptions of a downward trend in prices.
To read this pattern, there are two phases to pay attention to: the formation of two W letters and the bullish phase.
Meanwhile, some of the advantages of this one chart pattern lie in its easy use, ability to show a reversal of direction, and can be used as a reference for entry buys.
So, now you understand what the triple bottom pattern is and its strategy.
Furthermore, you can also read interesting articles, such as the triple top pattern to the falling wedge pattern at INDODAX Academy.
Let’s Invest in Crypto
After understanding the triple bottom pattern, now is the time for you to start investing in crypto assets at INDODAX.
However, it is important to reiterate that crypto investing also involves high risks, including price volatility, regulatory uncertainty, and security risks.
Therefore, before deciding to invest in crypto or any other asset, it is important to research and consults with a financial professional to understand the risks and rewards.
So, to trade on INDODAX, you can first download the latest version of the INDODAX application
on Android and IOS.
In it, various features will help you as a trader.
Then, all you have to do is enter the INDODAX market page and make buying and selling crypto assets easily right from your hand.
Come on, start trading right now!
 Market

