Neckline in trading is one of the important elements in technical analysis used to identify price reversal patterns.
This concept often appears in patterns such as double tops and double bottoms, which help traders determine support and resistance levels.
In a double top pattern, the neckline acts as a lower limit that, if broken, indicates a potential for further price declines.
Conversely, in a double bottom pattern, the neckline acts as an upper limit that, if broken, indicates a possible price increase.
By understanding the neckline, traders can more easily identify optimal entry and exit points, and better manage risk in their trading strategies.
People Also Read This: How to Scalp Crypto and Its Must-Know Indicators
What is Neckline Trading?
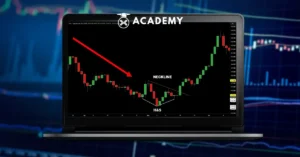
Necklines are trend lines used in technical analysis to connect key points in price patterns, such as double tops, double bottoms, and head and shoulders.
In a double top pattern, the neckline acts as a support level that, if broken, indicates a potential price reversal downwards.
Conversely, in a double bottom pattern, the neckline acts as a resistance level that, if broken, indicates a potential further price increase.
The neckline is also an important part of the head and shoulders pattern, where this line connects the lowest points of the left and right shoulders, which can be a signal for traders to determine entry and exit points in trading.
Basically, necklines are very useful in trading because they help identify strategic points to place buy or sell orders.
When the price breaks through the neckline in a reversal pattern such as the head and shoulders, this can be a strong indication that the price trend is changing.
However, traders must be careful in analyzing neckline breakouts. Not all price movements that pass through the neckline indicate a valid trend change.
If the price only breaks through the neckline with a small movement (less than 3%-4%), it is most likely just a temporary movement, not a true trend reversal.
Trading volume is also an important factor because increased volume when breaking through the neckline can strengthen the validity of the trend change signal.
Some chart patterns that often use the neckline as a key level include the following:
1.Double Top
Two almost identical price peaks, with the neckline as support at the bottom. A neckline breakout indicates a potential price decline.
1.Double Bottom
Two almost identical low points, with the neckline as resistance at the top. If the neckline is broken, the price tends to rise.
1.Head and Shoulders
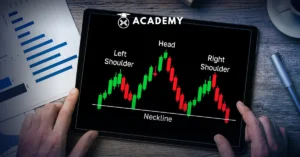
A pattern consisting of three peaks, with the middle peak higher than the other two peaks. The neckline connects the lowest points between these peaks and becomes an important level in determining the direction of the next trend.
People Also Read: Head and Shoulders Pattern, Trader’s Main Analysis Weapon
Why is Neckline Trading Interesting for Investors?
Neckline trading is one of the technical analysis techniques that is widely used by investors because it can help identify trading opportunities more accurately. Here are the reasons why neckline trading is interesting for investors:
1. Breakout Identifier
One of the main reasons why neckline trading is interesting for investors is its ability to identify breakouts or price penetrations.
When the price breaks through the neckline in a pattern such as a double top, double bottom, or head and shoulders, this is often an early signal of a larger price movement.
Breakouts that occur with high volume tend to confirm a change in trend so that traders can make buy or sell decisions with more confidence.
2. Profit Opportunities in Volatile Markets
In volatile markets such as stocks and crypto, sharp price movements often occur. Necklines can help investors find optimal entry and exit points so that they can take advantage of trend changes more effectively.
With the right analysis, traders can capture momentum before prices move too far, increasing profit opportunities while still managing risk well.
3. Effectiveness Across Timeframes
While necklines are often more effective on higher timeframes such as daily or weekly charts, the concept can still be applied to lower timeframes to spot short-term trends.
For example, day traders may use necklines on 5-minute or 15-minute charts to look for quick trading opportunities, while swing traders may focus more on daily or weekly timeframes to catch larger trends.
People Also Read: Time Frames in Trading: Choosing the Right One for Success
How to Use Necklines in Trading
Neckline trading can be used effectively by following several steps, from identifying chart patterns to managing risk with stop loss and take profit. Here is a guide to using it:
1. Identify Chart Patterns
The first step in using necklines is to recognize relevant price patterns, such as double tops, double bottoms, or head and shoulders. This pattern must form clearly before the neckline can be used as a reference for trading.
2. Waiting for Breakout
After finding a valid chart pattern, traders need to wait for confirmation of the breakout before making a decision. If the price breaks through the neckline with a strong movement, this can be an early signal to enter or exit a position.
3. Use Volume as Confirmation
A valid breakout is usually supported by high trading volume. If the price breaks through the neckline without increasing volume, there is a possibility that the breakout is weak or false.
Therefore, traders need to ensure that volume increases when the neckline breaks through.
4. Set Stop Loss and Take Profit
To manage risk, traders should set a stop loss above or below the neckline, depending on the direction of the trade taken.
In addition, setting a take profit at the appropriate level will help lock in profits when the price moves according to predictions.
With a good risk management strategy, traders can use the neckline more effectively in trading.
People Also Read This: What is a Chart? Know the Types and Guide on How to Read It
Factors Affecting the Success of Neckline Trading
The success of neckline trading is influenced by various factors, including asset performance, market conditions, and external factors that can affect the validity of the pattern formed. Here is a complete review:
1. Team or Asset Performance
The success of neckline trading is highly dependent on the performance of the traded asset, be it stocks, forex, or crypto.
If the asset is experiencing a strong trend or is supported by good fundamentals, the neckline pattern tends to be more valid and has a clearer chance of a breakout.
2. Market Conditions
Market sentiment also plays a role in determining whether the neckline will hold or be broken.
In a bullish trend, prices are more likely to break through the neckline upwards in a double bottom pattern, while in a bearish trend, the neckline in a double top pattern is more susceptible to being broken downwards.
3. External Factors
Major economic events, such as interest rate announcements, inflation, or geopolitical news, can suddenly change the direction of prices.
Even if the neckline has formed perfectly, external factors can trigger unexpected movements so traders need to stay alert to the latest developments in the market.
Risks in Neckline Trading
Neckline trading has several risks, such as false breakouts, market volatility, and changes in sentiment that can disrupt price predictions. Here’s the explanation:
1. False Breakout
One of the main risks in neckline trading is a false breakout, which is when the price appears to break through the neckline but then reverses direction.
This can cause traders to experience losses if they enter a position too quickly without additional confirmation, such as increased volume or a neckline retest.
2. Market Volatility
A highly volatile market, especially in instruments such as crypto or small-cap stocks, can cause unexpected price movements.
Even if the neckline pattern is clearly visible, a sudden price spike can invalidate predictions and thwart trading strategies.
3. Rapid Changes in Market Sentiment
Drastic changes in market sentiment due to economic news, monetary policy, or geopolitical factors can make neckline analysis less effective.
If market sentiment suddenly reverses, patterns that previously appeared strong may lose their validity, requiring traders to adjust their strategies quickly.
Conclusion
Well, that was an interesting discussion about the Complete Neckline Trading Guide for Beginner Traders that you can read in full at the Crypto Academy at INDODAX Academy.
In conclusion, neckline trading is one of the technical analysis methods that is useful in identifying support and resistance levels, as well as predicting potential breakouts that can determine the direction of future price movements.
This technique is widely used in various chart patterns, such as double tops, double bottoms, and head and shoulders, to help traders make more measured decisions.
However, although neckline trading can provide strong signals, its use should not be done separately.
Traders need to confirm the neckline signal with other technical indicators, such as trading volume, moving averages, or RSI, in order to minimize the risk of false breakouts.
In addition, market conditions and external factors, such as economic news or global sentiment, also need to be considered before making decisions based on the neckline pattern.
With a deep understanding and a mature strategy, neckline trading can be an effective tool to increase the chances of success, especially in volatile markets.
Traders who are able to combine technical analysis with good risk management can use necklines to get more optimal entries and exits in their trading.
FAQ
1.What is a neckline in trading?
A neckline is a line that connects the two highest points in a chart pattern such as a double top or double bottom that functions as a support or resistance level.
2.How to use necklines in trading?
Traders wait for a price breakout through the neckline to decide on an entry point, confirming the signal with volume and other indicators.
3.What is a false breakout in neckline trading?
A false breakout occurs when the price breaks through the neckline but then reverses direction, causing losses for traders who have not confirmed the signal.
4.Is neckline trading suitable for all types of markets?
Yes, neckline trading can be used in the stock, forex, and crypto markets, but the results can vary depending on market volatility and the chart pattern formed.
5.Is neckline trading only effective on high timeframes?
Although more effective on higher timeframes, necklines can also be used on lower timeframes to determine short-term trends.



 Polkadot 10.18%
 BNB 0.86%
 Solana 4.89%
 Ethereum 2.37%
 Cardano 1.68%
 Polygon Ecosystem Token 2.13%
 Tron 2.89%
 Market