Top Performers
![]() Home
/ Articles and Tutorials
Home
/ Articles and Tutorials

Support resistance is a term that is often encountered when trading. Curious about what is meant by support and resistance? Let’s see more here!
Etherscan.io is an independent Ethereum-based block explorer. This application tracks blockchain transactions on the Ethereum network. Then, the application will display results like a search engine.
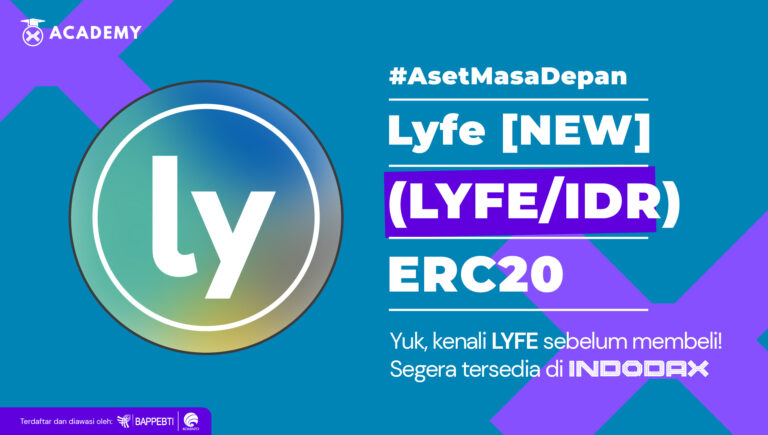
The new LYFE will later have more functions, including being able to exchange it for property and get profit sharing from the property. The LYFE token initially ran on the BEP2 network, while the LLAND token ran on the ERC20 network.
Blockchain wallet is essential to know in the growing popularity of the blockchain world today. Read more here!

The LUNA Classic (LUNC) is the original Terra LUNA coin following the recent UST/Luna collapse and the creation of the new Terra chain.
Reserve Rights token (RSR) is a crypto asset used to facilitate the stability of Reserve tokens.
H2O DAO is BEP20 crypto asset and the world’s first decentralized traffic distribution platform that adopts DAO governance. Curious? Come on, read more here!

Flux is the crypto that powers the Flux ecosystem. It has several uses, including purchasing resources, pledging nodes, pushing transactions in FluxOS

BinaryX works with BEP-20 networks and transitioning into a GameFi platform that offers IGO services to bridge Web2 developers to Web3. Curious? Come on, read more here!
Crypto assets trading can be considered a high-risk activity, where crypto assets prices are volatile, and can swing wildly, from day to day. Please do your own research (DYOR) before making the decision to invest in, or to sell crypto assets. INDODAX is not soliciting for users to buy or sell crypto assets as an investment or for profit. All crypto assets trading decisions should be made independently by the user.
Copyright © 2022 PT Indodax Nasional Indonesia. All Rights Reserved.