In the trading world, be it stocks or crypto assets, several chart patterns are used to predict price movements. One chart pattern that is important for traders to know is the golden cross.
This pattern is considered a “golden opportunity” because it is often identified as an early indicator of a potential bullish trend. In technical analysis, understanding the Golden Cross can provide a more in-depth view of changes in market direction and allow traders to make informed investment decisions.
Now, check out the full review below to understand what a Golden Cross is, from its definition to how it differs from the Death Cross pattern!
What is the Golden Cross?
Golden Cross is a chart pattern that occurs when two Moving Average (MA) lines converge at a certain point. The first line is an MA that reflects the average price movement of an asset over a relatively short period, while the second line is an MA that covers the average price movement over a longer period.
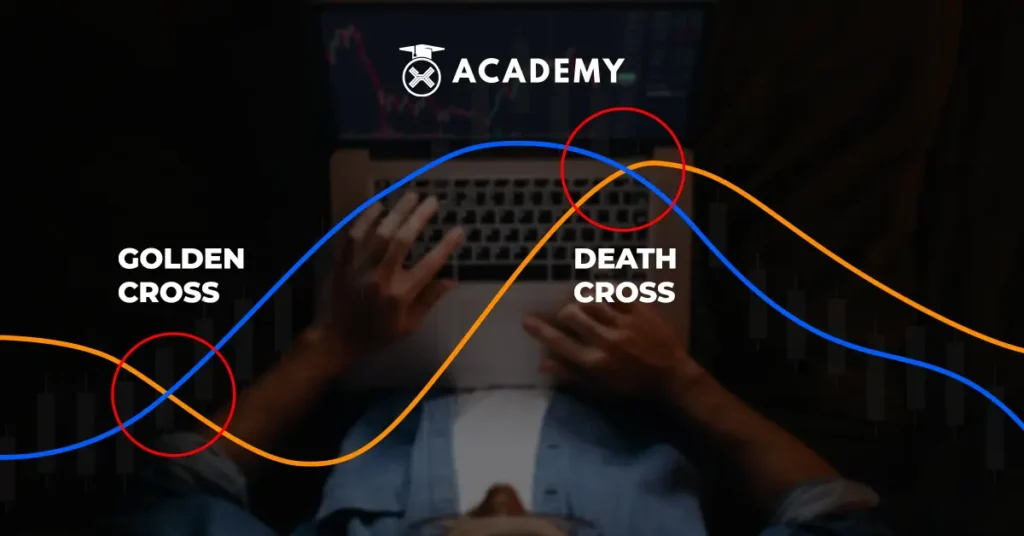
In a Golden Cross, the short-range MA line “crashes” and crosses over the longer-range MA line. For traders, this crossover signals a bullish breakout.
This means that there is an indication that the asset’s price is currently experiencing significant growth, exceeding its moving average over a longer period. Thus, the Golden Cross is a sign for traders to accumulate and get ready to capitalize on potential profits that may appear in the near future, as represented by the metaphorical “golden signal.”
How Does the Golden Cross Form?

Aside from providing breakout signals, this pattern has another advantage: its ease of recognition for traders. However, market participants still need to understand the stages of the formation of this cross to anticipate it better.
In general, the Golden Cross is formed through the following three stages, among others:
1. Downward Trend
Initially, there is a downward trend in asset prices due to significant selling pressure in the market. However, market participants need to remain vigilant during this phase, as some traders may take advantage of this downward momentum to accumulate the asset. At the same time, it is low (buy the dip). Typically, this action can result in an increase in the asset’s price in the near future.
To confirm your forecast, the second step is to check the crossover between the short-period Moving Average (MA) line and the long-period MA line.
2. Occurrence of Crossovers
In this stage, the first step is to plot the short and long-period Moving Average (MA) lines on the observed price chart to determine the likelihood of their crossover.
Generally, there is no standard for determining the period for each MA line. However, many traders use a 200-day MA for the long-period MA line and a 50-day MA for the short-period MA line.
Alternatively, traders may refer to shorter periods, such as a 15-day MA for the long-period MA line and a five-day MA for the short-period MA line, especially if they focus on a day trading style.
By choosing either method, pay attention to whether the short-period MA line continues to rise and is likely to “cross” the long-period MA line. If this happens,, a Golden Cross pattern will be expected to form.
This stage reflects an increase in the market’s demand volume, prompting the asset price to rise.
3. Sustained Uptrend
After the occurrence of the Golden Cross, it can be anticipated that the asset’s price trend has switched to bullish. This stage is considered the pattern’s crucial or “confirmation stage” and is a good time to start executing the prepared trading plan.
Price movement history shows that the uptrend after a Golden Cross tends to last relatively long, providing traders an opportunity to profit.
Confirming the Golden Cross
Although it may seem easy to spot, the Golden Cross can sometimes give false signals. Therefore, you need to be aware of this and be able to identify this pattern wisely.
To avoid possible mistakes and potential losses, here are the steps you can apply to confirm the Golden Cross, among others:
1. Pay attention to Trading Volume
Remember that trading volume is an important element in an asset’s price movement dynamics. Therefore, the higher the trading volume during a Golden Cross, the greater the bullish potential should be.
2. MA Period
The period chosen to set the two MA lines is important in tracking the Golden Cross. For example, a possible Golden Cross can be detected using MA 5 and MA 15, but it may not be seen if MA 50 and MA 200 are used.
Therefore, it is advisable to analyze the movement of the MA line used by comparing it with another period-based MA line. If both show a similar direction of movement, it can be assumed that the asset price will likely experience a strong uptrend.
3. Confirmation with Other Indicators
It’s good not to be immediately tempted when you see the short MA and long MA lines crossing. Instead, the next step is to confirm an uptrend’s presence using additional technical analysis indicators.
In this case, many traders utilize technical analysis indicators such as oscillators, Moving Average Convergence and Divergence (MACD), and Relative Strength Index (RSI) to assess whether the market is overbought or oversold.
These indicators will help determine the momentum of buying, selling, and stopping loss levels.
What is Death Cross?
Quoting hsb.co.id, a Death Cross is a technical indicator that signals a potential trend change from bullish to bearish. This signal comes when the short-term moving average line (MA50) crosses below the long-term moving average line (MA200).
In technical analysis, the MA50 and MA200 are commonly used as monitoring tools by traders and investors. The MA50 reflects price movements in short periods, while the MA200 indicates trends in the long term.
A crossover of the MA50 below the MA200 indicates a price decline over a short period and often signals a potential switch from a previous bullish trend to a bearish trend.
Difference of Golden Cross vs. Death Cross

Quoting investopedia.com, the Golden Cross and Death Cross are opposing indicators. A golden cross confirms a long-term bullish market, while a death cross signals a long-term bearish market.
Both crossovers are considered more significant when accompanied by high trading volumes. Once the crossover occurs, the long-term moving averages are considered the key support levels (in the case of a golden cross) or key resistance levels (in the case of a death cross) for the market from then on.
Both golden and death crosses can appear and signal a trend change, but they are more common when a change has occurred. All indicators are “lagging,” meaning the data used to form the chart has already been collected.
That means that no indicator can truly predict the future. Often, an observed golden cross results in a false signal.
Despite having a predictive power that seems effective in forecasting large bull markets in advance, golden crosses also often fail to occur. Therefore, other signals and indicators should always be used to confirm a golden cross.
Trading Strategy with Golden Cross
The Golden Cross pattern is a bullish trend opening signal among traders. A famous bullish signal among global traders is the formation of a Golden Cross between the Moving Average (MA) 50 and MA 200 lines on the S&P 500 index.
When this pattern appears on the S&P 500 index, buying usually spreads to all stocks in the world’s most bona fide stock index.
If you encounter a similar occurrence in your price chart, then you can listen to some strategies that should be taken to take advantage of the Golden Cross momentum below, including:
1. Entry when the Pattern is Confirmed
Traders generally believe that the best opportunity to open a buy position is after a Golden Cross is confirmed, where the price trend follows the direction of the signal. This is done to avoid the possibility of being trapped by false signals.
Although the Golden Cross promises a potential bullish breakout, it’s important to be patient and wait for the momentum to confirm before entering a buy position.
2. Set Stop Loss on MA lines with Long Periods
Once the Golden Cross is confirmed, the uptrend may continue. This breakout makes the second Moving Average (MA) line, representing a longer period, a support level.
Therefore, you can use this area to set a stop-loss position.
3. Death Cross
There is no exact formula to measure how much profit can be made from a Golden Cross. However, it often ends with a recrossing of the Moving Average (MA) lines.
The difference this time is that the cross occurs when a long-period MA crosses and crosses below a shorter-period MA line.
This situation, known as a Death Cross, indicates that the trend is about to turn bearish. If you see these signals, you should start planning your exit position from the market.
Golden Cross Examples
Quoting investopedia.com, the image below uses the 50-day and 200-day moving averages.
:max_bytes(150000):strip_icc():format(webp)/GoldenCross-5c6592b646e0fb0001a91e29.png)
Image source: Investopedia
The 50-day moving average trended down over several trading periods, eventually reaching a price level the market could not support. The 200-day moving average flattens out after a slight downtrend.
Prices slowly increase, creating an uptrend in the 50-day moving average. This trend continues, pushing the shorter-period moving average higher than the longer-period moving average.
A golden cross forms, confirming the reversal from a downtrend to an uptrend.
Notice that the price range of the candlesticks undergoes a significant spike when the downtrend reaches its bottom and turns into an uptrend. Something likely happened that changed the market sentiment of investors and traders.
The candlestick bodies (the difference between the opening and closing prices) are quite large, and more days close with prices much higher than the opening during the first spike after the 50-day moving average reaches its bottom.
Is the Golden Cross Indicator Reliable?
As a lagging indicator, the golden cross is identified only after the market has risen, which makes it look reliable. However, this delay makes it difficult to know when the signal is false until after the fact.
Traders often use the golden cross to confirm trends or signals, usually in combination with other indicators.
Conclusion
To conclude, as a technical analysis tool, the Golden Cross is a chart pattern that signals a potential change from a downtrend to an uptrend. It occurs when a short-period moving average (MA) line crosses above a long-period MA line.
The Golden Cross is a long-term bullish signal often used by traders and investors to identify potential entry points.
However, remember that the Golden Cross is not a perfect tool. Traders must combine the Golden Cross with other indicators and consider fundamental factors before trading.
As a disclaimer, to hone your trading skills using the Golden Cross pattern, it is better to continue learning by reading various collections of interesting articles on INDODAX Academy.
To expand your understanding of blockchain technology, you are strongly encouraged to access and read the latest articles provided by INDODAX Academy.
INDODAX Academy presents a variety of materials covering basic concepts and more in-depth aspects of blockchain technology.
By listening to various articles on INDODAX Academy, you can deepen your understanding of this technology, including its application, and get the latest information about the crypto world.
Let’s continue to improve your understanding of blockchain and crypto assets with INDODAX Academy!
Invest in Crypto on INDODAX with Staking (EARN) Feature
Now you understand what a Golden Cross is, starting from understanding the difference with the Death Cross pattern.
Furthermore, if you are interested in investing in crypto assets, you should choose a safe and reliable Indonesian crypto exchange, INDODAX.
At INDODAX, there is a feature called crypto staking or crypto earn. It is important to note that the crypto staking feature allows you to secure your crypto assets similarly to keeping funds in a savings account.
Crypto assets locked through the INDODAX Earn feature will provide rewards like the interest earned from savings.
It should also be noted that the INDODAX Earn crypto staking feature can be accessed easily, anytime and anywhere, either through the Mobile App or desktop on the INDODAX website, namely on the INDODAX Earn crypto staking page.
Start investing in crypto assets right now with the INDODAX Earn crypto staking feature!
 Market

